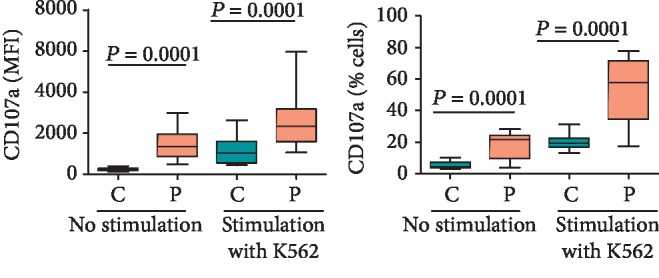
Figure 7.

The surface expression of CD107a on CD56bright/dim NK cells in CD patients vis-à-vis healthy controls with and without prior stimulation with K562. The panels show MFI of CD107a expression and percentages of CD107a expressed in NK cells. The box and whisker plots indicate median, interquartile ranges, and p values from ten treatment-naïve CD patients and the same number of healthy control donors.
