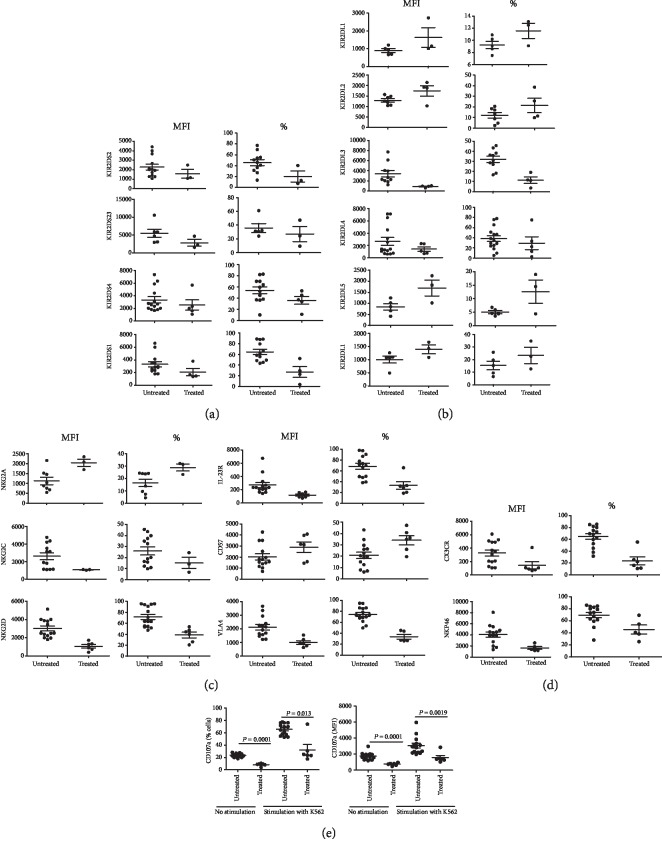
Figure 8.
Comparison of NK cell expression of different parameters between treatment-naïve (untreated) and under-treatment (treated) CD patients. The figure shows NK cell expression of activating KIR (a), inhibitory KIR (b), non-KIR receptors and VLA-4 (c), NKP46 and CX3CR1 (d), and CD107a with and without stimulation with K562 cells (e). This figure shows means ± SE and p values.

