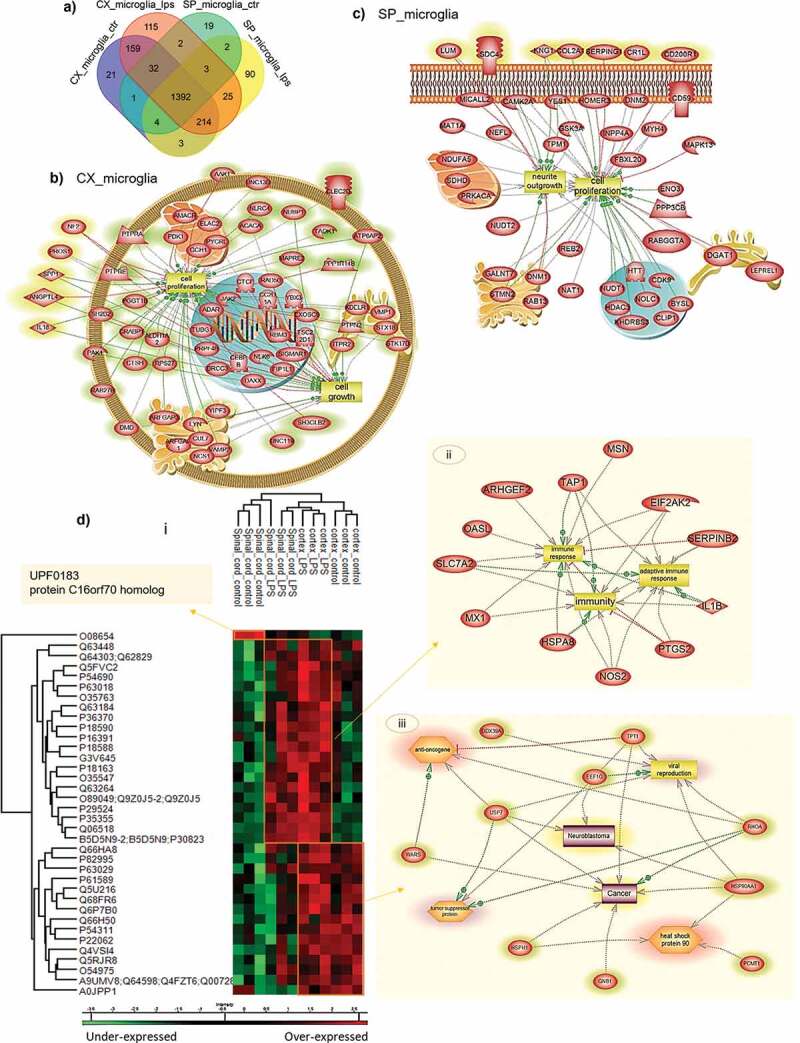
Figure 2.

Shot gun analyses of proteins isolated from cortex or spinal cord microglia cells. (a) Venn diagram of the unique protein of microglia cells. Pathway analyses of specific proteins isolated from (b) Cx-M and (c) SpC-M, after treatment 500 ng/mL LPS for 24 h. (d) Representative Heat map of the common proteins, quantified by label free and analyses by MaxQuant with a P value = 0.05 (i), and pathways obtained from each cluster: pathway analyses of cluster 2, common to spinal cord and Cx-M after LPS treatment (ii), and pathway analyses of cluster 3, containing only Cx-M (iii). The analyses were performed in triplicate (n=3)
