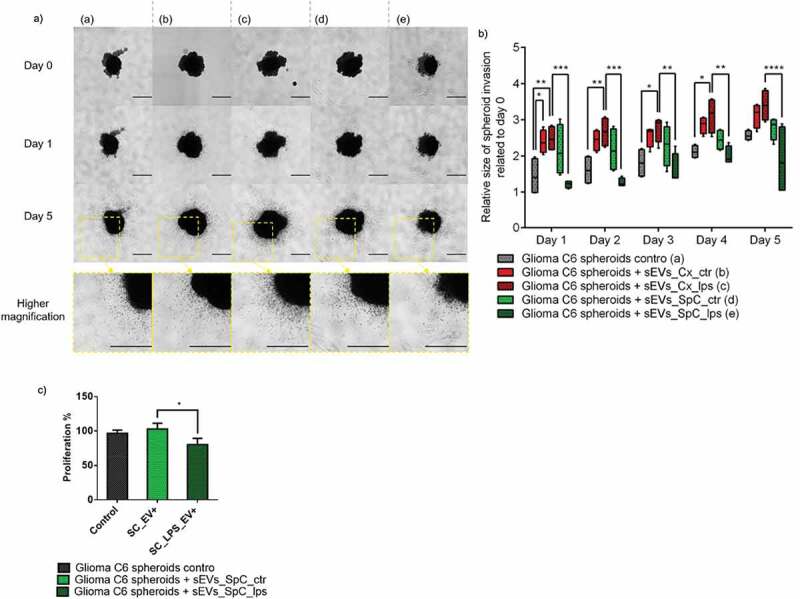
Figure 6.

Impact of microglia derived sEVs on glioma spheroids. (a) Representative images of the invasion of C6 spheroids in the collagen matrix at day 0, 1 and 5. Spheroids are in the absence or in the presence of sEVs released by SpC-M and Cx-M not treated or treated with 500 ng/mL LPS for 24h. All images were acquired with an inverted light microscope at 5× magnification. Scale bar: 500 μm. Insets represent spheroid at day 5 at a higher magnification. The results obtained are depicted through a box plot figure (b). Significant differences were identified using Tukey’s multiple comparisons test. (c) Quantification of proliferation of C6 glioma spheroids in presence of sEVs isolated from the CM of control and LPS stimulated SpC-M compared to control C6 spheroids without sEVs. The analyses were performed in replicate (n = 3).
