Figure 1:

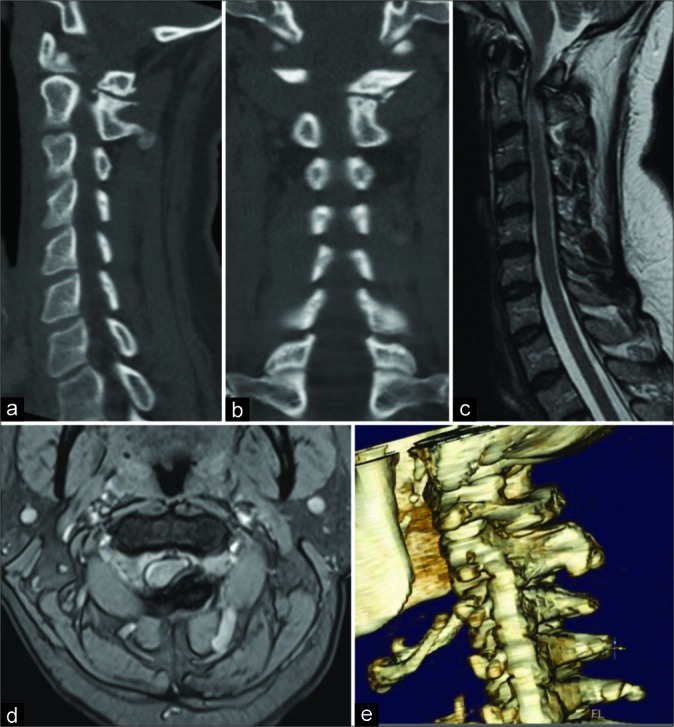
Computed tomography (CT) images in sagittal (a) and coronal (b) plans show an osseous pseudojoint between the left lamina of C1 and C2. T2-weighted magnetic resonance images in the sagittal (c) and axial (d) planes demonstrate the degree of cord compression caused by the complex. Finally, the topography of the pseudojoint can be appreciated on three-dimensional CT reconstruction (e).
