FIG. 7.
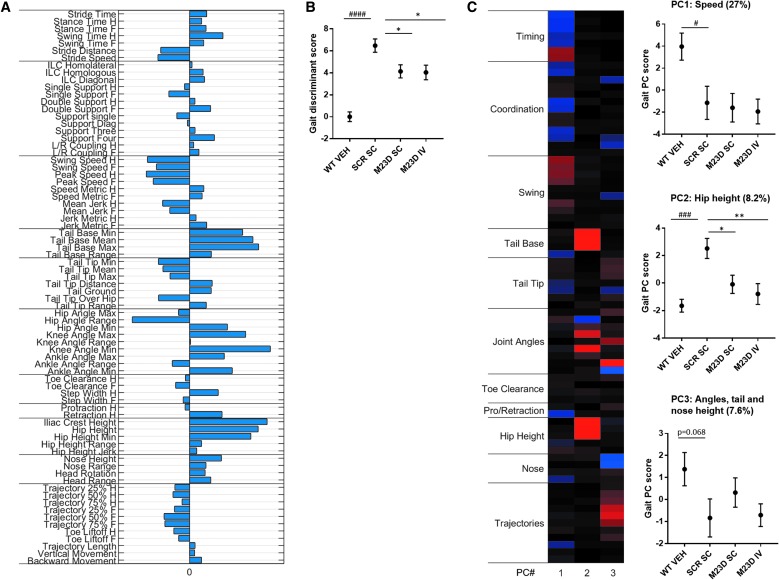
MotoRater analysis of VEH-treated WT mice compared to SC and IV dosed mdx mice at 14 weeks of age. (A) Discriminant vector representing an overall kinematic fingerprint of and the differences between VEH-dosed WT mice and scrambled control-dosed mdx mice. (B) Overall gait discriminant score, based on the established discriminant vector. (C) Heatmap showing three PC clusters reflecting different gait features that differ between VEH-dosed WT mice and scrambled M23D-dosed mdx mice. Per cluster, the corresponding gait score is represented in a graph (PC1: speed, PC2: hip height, and PC3: angles, tail, and nose height). The % of total variation of the data explained per cluster is indicated above each graph. Values are presented as mean ± SEM (n = 10). Significance between the scrambled control and WT group was assessed using an unpaired two-tailed t-test (#P < 0.05; ###P < 0.001; ####P < 0.0001). Significance between the mdx groups was assessed using ANOVA and Tukey's multiple comparison test (*P < 0.05, **P < 0.01).

