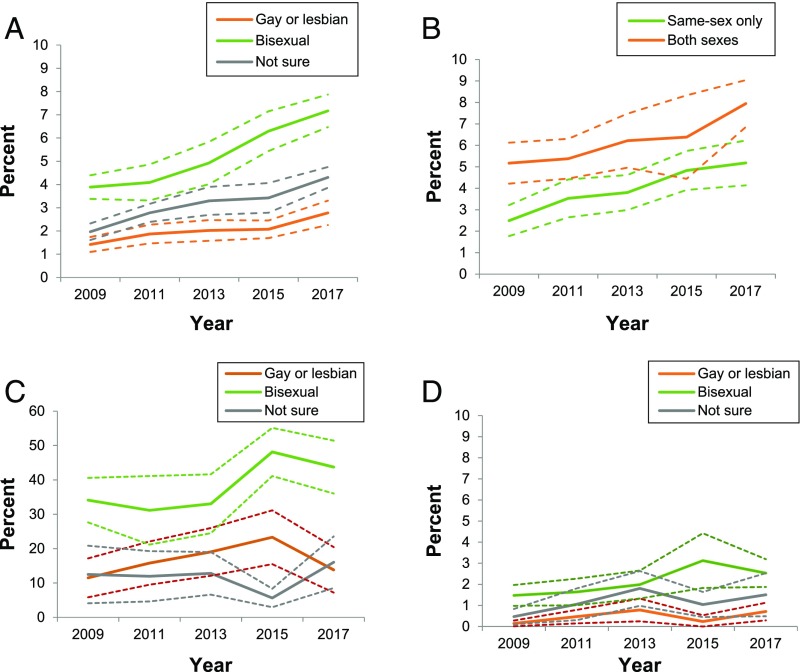
FIGURE 1.
Changes in reported sexual minority orientation identity and same-sex sexual contacts over time. A, Sexual minority orientation identity over time. B, Sex of sexual contacts over time. C, Sexual orientation among students with same-sex sexual contacts. D, Sexual orientation among students with opposite-sex sexual contacts. Note that y-axis scales range from 0% to 10% for all graphs except for the bottom left (C), where the scale is from 0% to 60%. Heterosexual sexual orientation identity and opposite-sex sexual contacts are excluded from the graphs, so the graphs can be presented at a scale that improves visualization of temporal changes in sexual minority identity and in same-sex sexual contacts.

