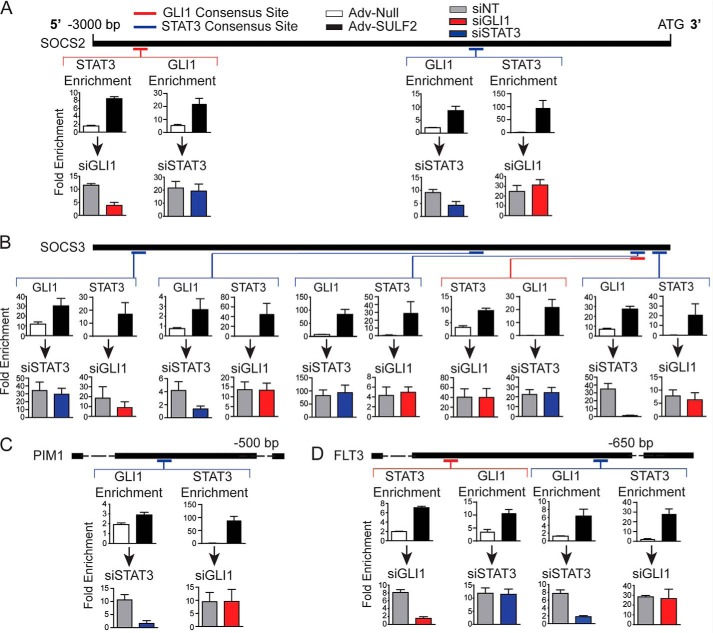
Figure 5.
SULF2 expression induces GLI1 and STAT3 enrichment at reciprocal consensus binding sites. Depicted in this figure are reproductions of the 3000 nucleotide promoter maps depicted previously for SOCS2 (A), SOCS3 (B), PIM1 (C), and FLT3 (D). Relative positions of consensus binding sites for GLI1 (red) and STAT3 (blue) are depicted on the promoter maps. Four separate ChIP-PCR assays were performed for each depicted consensus binding site represented as the bar graphs below each site. The top two graphs depict either STAT3 or GLI1 -fold enrichment at that site in Huh-7 cells transduced with either Adv-Null (n = 3) or Adv-SULF2 (n = 3). The bottom pair of graphs represent ChIP-PCR assays in Huh-7 cells transfected with either siNT (gray bars, n = 3) or siRNA against GLI1 (red bars, n = 3) or STAT3 (blue bars, n = 3) prior to transduction of Adv-SULF2. Results are expressed as means ± S.E. (error bars).

