Figure 6.
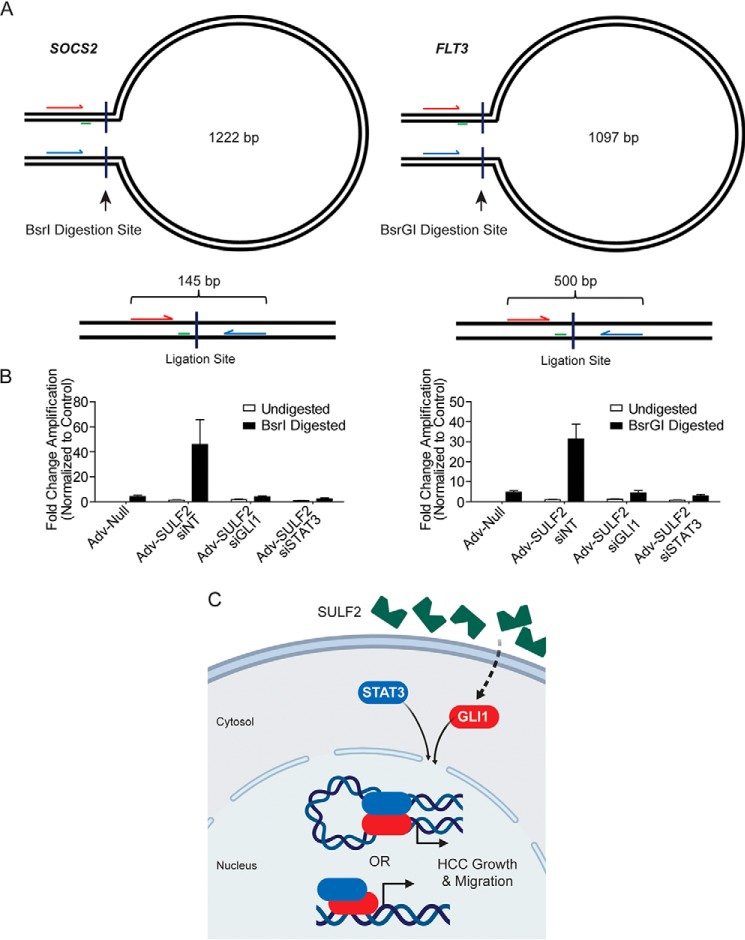
GLI1 and STAT3 coordinately control promoter conformation in HCC cells. A, schematic of experimental design for chromatin conformation capture assays not presented at scale. Forward and reverse primers are arrows indicated in red and blue, respectively. Perpendicular lines indicate the site of restriction digestion with the indicated enzyme. Green lines, location of the TaqMan probe. The presented base pair length indicates the distance between restriction digestion sites in the SOCS2 and FLT3 promoters. Below each loop diagram is a representation of the ligation product with predicted amplicon length after digestion and ligation. B, results of qPCR using primers depicted in A. Because the ligation product of interest is rare, data are presented as -fold change in amplification normalized to the undigested control. Huh-7 cells were transfected with siNT (n = 6), siGLI1 (n = 6), or siSTAT3 (n = 6). Afterward, they were transduced with either Adv-Null (n = 6) or Adv-SULF2 (n = 18). DNA was either undigested as a negative control or digested with the restriction enzyme depicted. Results are expressed as means ± S.E. (error bars). C, diagram depicting a working model of SULF2-potentiated liver tumorigenesis. SULF2 overexpression results in increased GLI1 expression and enrichment at target genes. Co-regulation of genes occurs with STAT3 through heterodimerization and either co-enrichment or promoter DNA looping to mediate gene expression.

