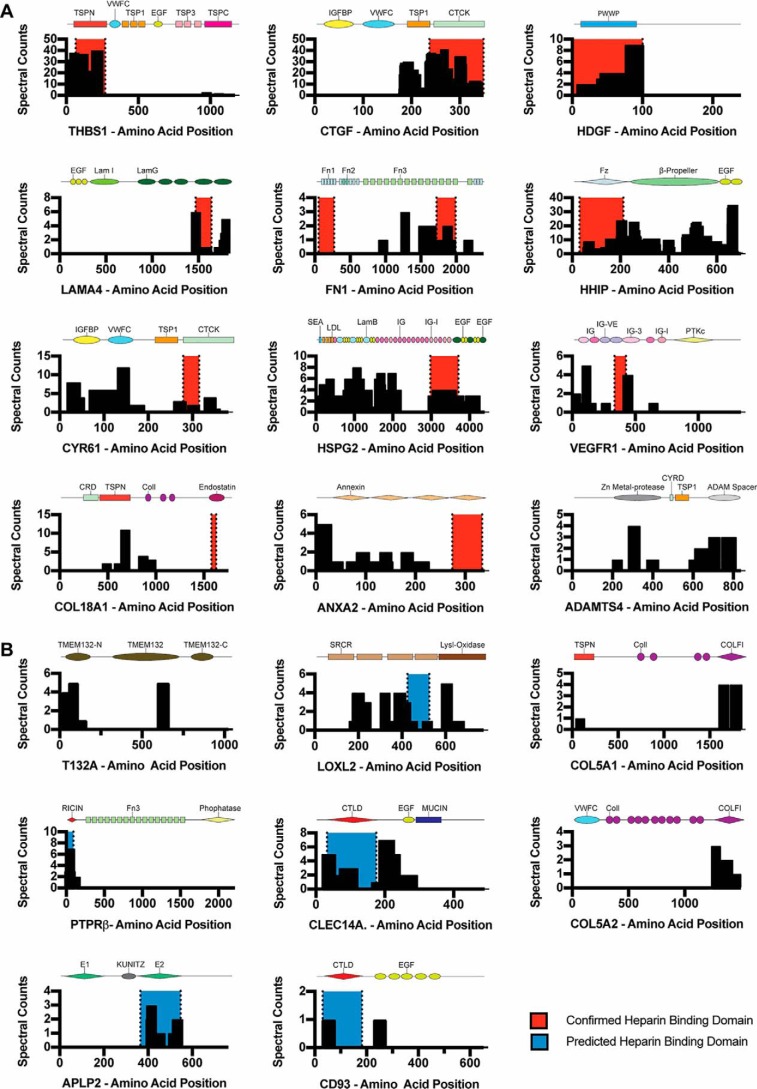
Figure 2.
Limited proteolysis selects for ectodomains of cell-surface proteins and maps to putative sites. A and B, alignment and mass spectral counts of peptides detected by LPHAMS (black bars). Red highlighted areas represent documented heparin-binding sites, and blue highlighted areas represent putative heparin-binding sites based on LPHAMS and modeling studies. The subdomains comprising each protein are shown schematically in each panel. A, peptide alignments of known heparin-binding proteins. B, peptide alignments of previously unknown heparin-binding proteins.

