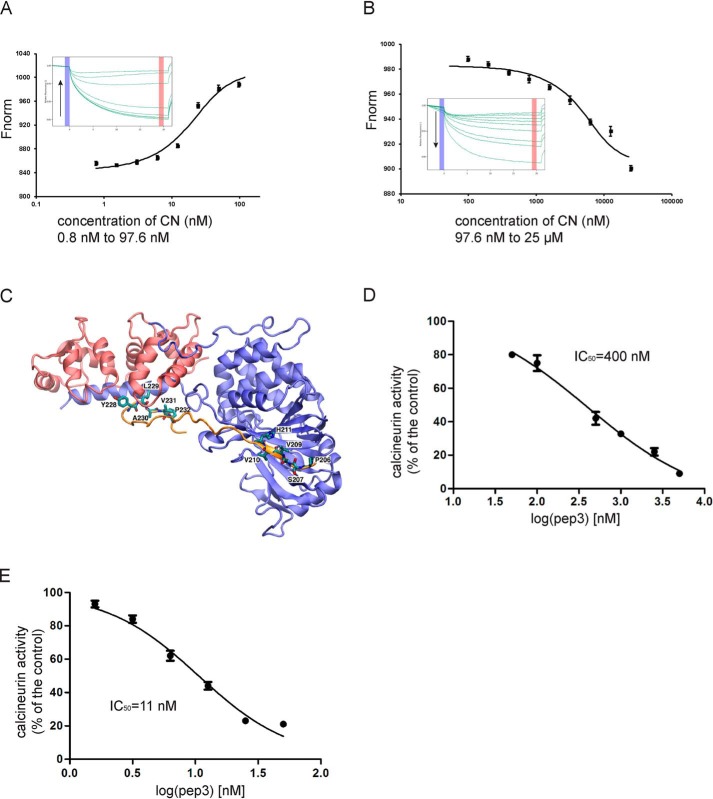
Figure 2.
Pep3 binds to purified recombinant CN and inhibits its activity. A and B, titrating CN to a constant FAM-labeled pep3 system yielded a biphasic MST signal. Fitting the high affinity phase (A) reveals a Kd = 8.6 ± 0.3 nm, and fitting the low affinity phase (B) yields a Kd = 1.6 ± 0.2 μm. The inset panels in A and B show the isotherm derived from the raw data, fitted to a sigmoidal dose-response curve, and the raw thermophoresis data were recorded at 20 °C using 20% LED power and 20% MST power. C, the modeled structure of the pep3-CN complex. CNA (blue), CNB (red), and pep3 (orange) are shown in cartoon presentation, and the two critical CN-binding motifs YLAVP and PSVVVH are shown as sticks. The complex structure is stable during the 100-ns MD simulation. D, inhibition of purified recombinant CN activity by pep3. E, inhibition of CN activity in the lysates of Jurkat cells. All data are expressed as the mean ± S.E. of phosphatase activity in three duplicable experiments.

