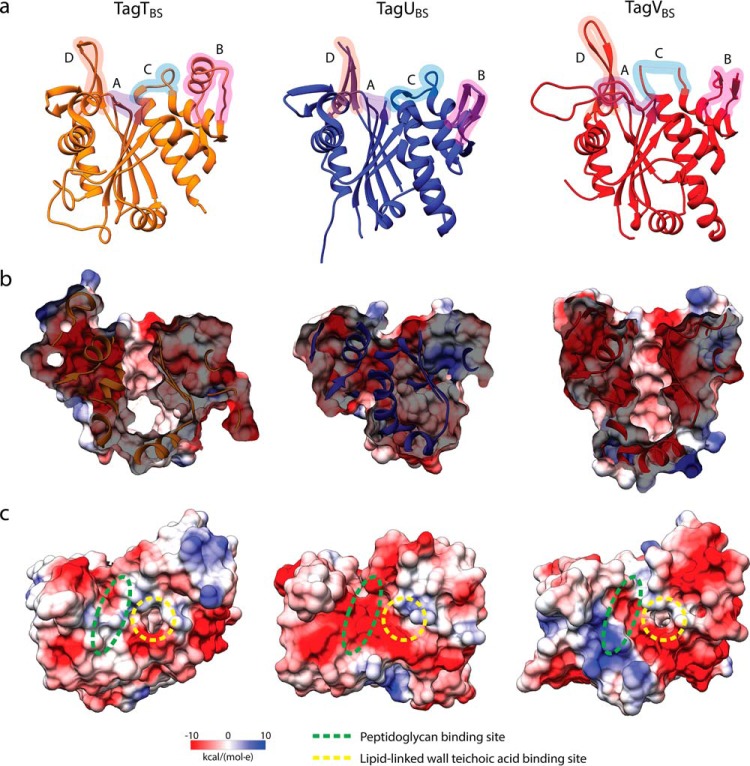
Figure 2.
Crystal structures of B. subtilis TagT, TagU, and TagV. a, ribbon structures of TagTBS (orange), TagUBS (blue), and TagVBS (red) with labeled regions surrounding the active sites (A, B, C, and D). b, the lipid-binding pockets are shown as cross-sections (side views) with electrostatic potential surfaces. c, the locations of the substrate-binding sites are outlined in the top views of the surfaces.

