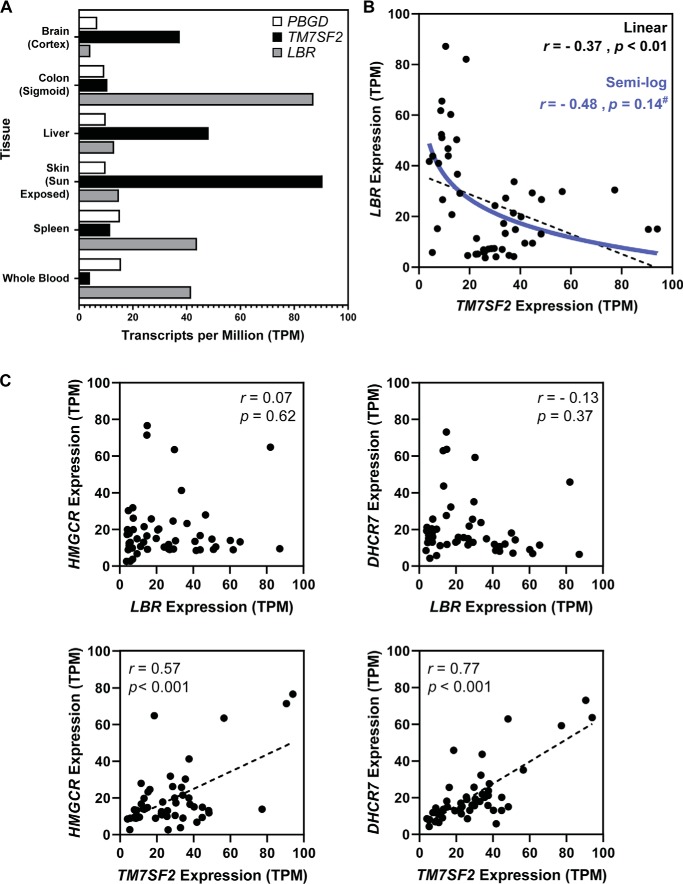
Figure 8.
Human tissue gene expression of TM7SF2 versus LBR. Analysis of gene expression suggests a reciprocal, nonlinear relationship between TM7SF2 and LBR gene expression. A, bar chart of PBGD, TM7SF2, and LBR expression, using the publicly accessible data for six listed human tissues from the GTEx expression database (dbGaP accession code phs000424.v7.p2). B, TM7SF2 and LBR expression (expressed as transcripts per million (TPM)), using data for 51 human tissues from the GTEx expression database (dbGaP accession code phs000424.v7.p2). Pearson's correlation coefficients were as follows: p < 0.01, r = −0.37. Semi-log relationship statistics were as follows: p = 0.14, r = −0.48 with data not significantly deviating (#) from the semi-log model. C, TM7SF2 and LBR gene expression versus HMGCR or DHCR7 gene expression (expressed as transcripts per million), using data for 51 human tissues from the GTEx expression database (dbGaP accession code phs000424.v7.p2). All statistical analysis was performed in GraphPad Prism 8.

