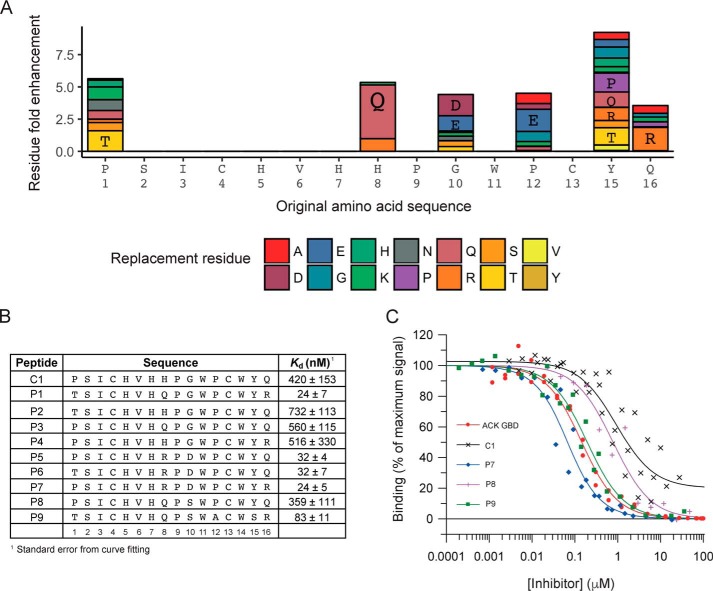
Figure 3.
A, enrichment of replacement residues in second generation peptides after maturation by CIS display. At positions where the parent residue was proportionately decreased in abundance after four rounds of biopanning of the cyclic maturation library, the relative enrichment of replacement residues at each amino acid is shown in the bar chart. Amino acids are individually colored as shown in the key and labeled using the one-letter code where they have a greater than 2-fold enrichment. B, second generation peptides. The nine selected sequences from the maturation screen are presented. Their affinities for Cdc42·GTP were determined by competition SPA, and their Kd values are given together with the standard error form curve fitting. n ≥ 2. C, representative SPA data. Increasing concentrations of the ACK GBD or the peptides were titrated into a fixed concentration of [3H]GTP·Cdc42 and GST–WT ACK GBD in competition SPAs. The Kd for Cdc42 binding to GST–WT ACK GBD was fixed to the value (30 nm) obtained for this Kd in direct SPAs. The data were fitted to an isotherm describing a pure competition model (58) to give an apparent Kd (Ki) value for the peptides. The data and curve fits are displayed as a percentage of the maximal SPA signal in each assay.

