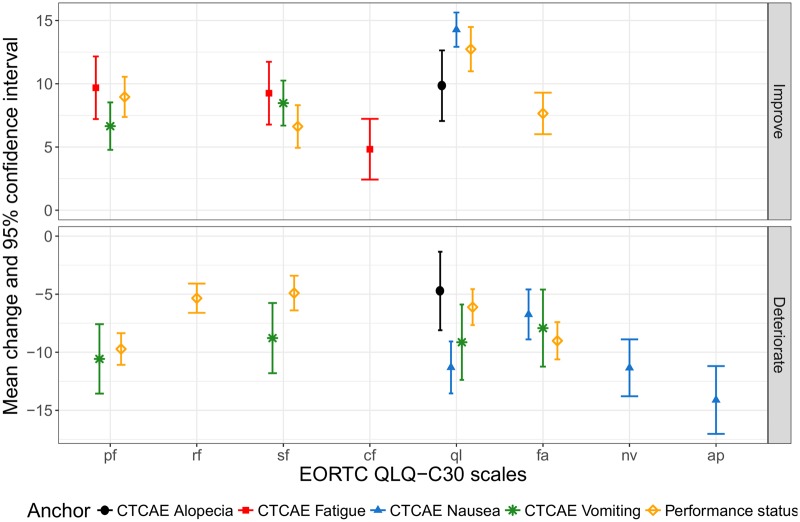
Figure 1.
Mean change and 95% confidence interval for improvement and deterioration EORTC QLQ-C30 scales, across multiple anchors and averaged across different time periods. Estimates are available only for scales with at least 1 suitable anchor and with effect size ≥0.2 and <0.8 within the “deteriorate” and “improve” groups, respectively. These mean change scores are useful for interpreting within-group change over time. AP = appetite loss; CF = cognitive functioning; CTCAE = common terminology criteria for adverse events; deteriorate = worsened by 1 anchor category; EORTC QLQ-C30 = European Organisation for Research and Treatment of Cancer Quality of Life Questionnaire Core 30; FA = fatigue; Improve = improved by 1 category; NV = nausea and/or vomiting; PF = physical functioning; QL = global quality of life; RF = role functioning; SF = social functioning.

