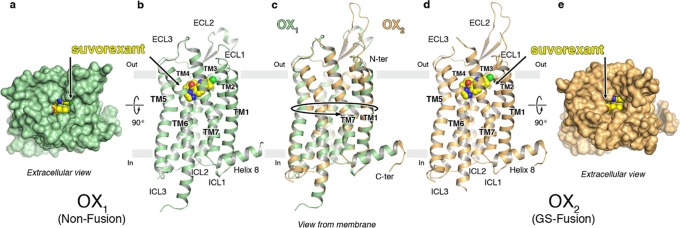
Figure 1.
Overview of the OX1 and OX2–antagonist complex crystal structures. (a–e) Overview of the OX1 and OX2 StaR structures in complex with suvorexant. (a) View from the extracellular space of OX1 in a surface representation (green) and suvorexant in a sphere representation with carbon, nitrogen, oxygen, and chlorine atoms colored yellow, blue, red, and green, respectively. (b) View of the OX1 receptor in a cartoon representation from a plane parallel to the membrane colored as in panel (a): approximate membrane boundaries are shown, and TM helices and loops are labeled. (c) Overlay of the OX1 and OX2 structures in a cartoon representation; receptors are colored green and gold. (d) View of the OX2 receptor in a cartoon representation from a plane parallel to the membrane colored as in panel (c): TM helices and loops are labeled, and suvorexant in a sphere representation is colored as in panel (a). (e) View from the extracellular space of OX2 in a surface representation (gold) and suvorexant in a sphere representation colored as in panel (a).

