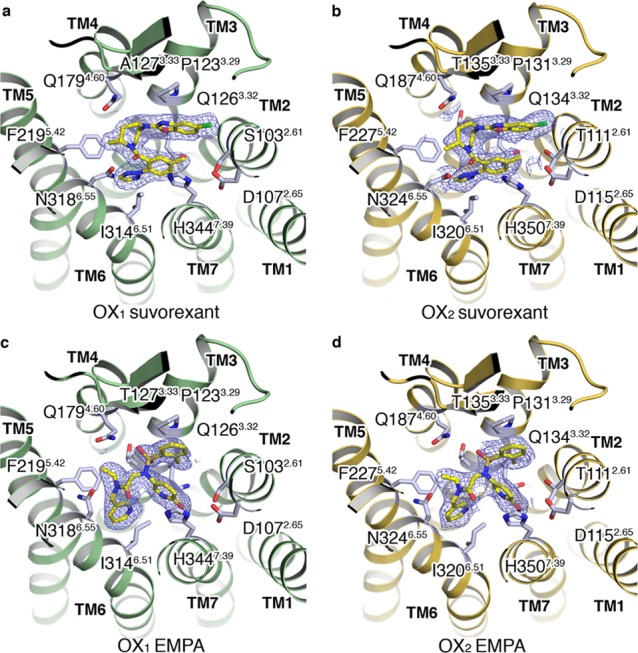
Figure 2.

(a, b) Extracellular views of the OX1 and OX2 StaR structures in complex with suvorexant (2). (c, d) Extracellular views of the OX1 (A127T) and OX2 StaR structures in complex with EMPA (8). Ligands shown in a stick representation with carbon, nitrogen, oxygen, and chlorine atoms colored yellow, blue, red, and green, respectively. Ligand 2Fo–Fc electron density maps in blue mesh and contoured at 1.0σ.
