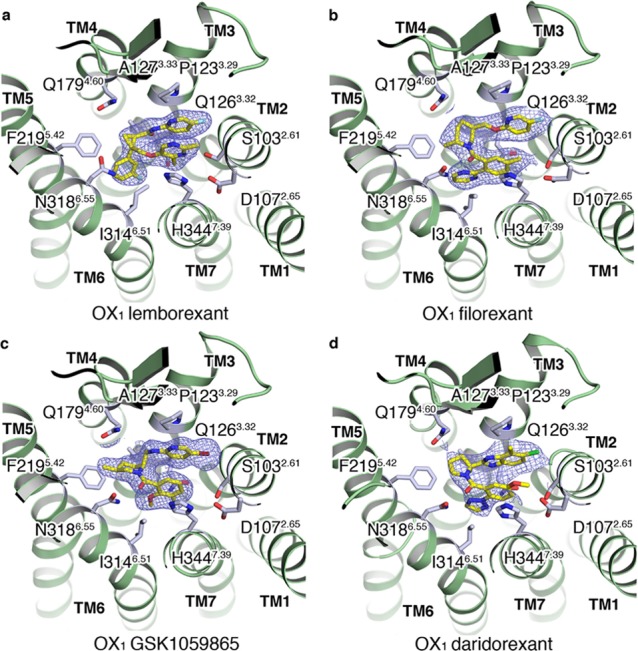
Figure 3.

(a–d) Extracellular views of the OX1 StaR structures in complex with lemborexant (4), filorexant (3), GSK1059865 (10), and daridorexant (5), respectively. Ligands shown in a stick representation with carbon, nitrogen, oxygen, chlorine, and fluorine atoms colored yellow, blue, red, green, and cyan, respectively. Ligand 2Fo–Fc electron density maps in blue mesh and contoured at 1.0σ.
