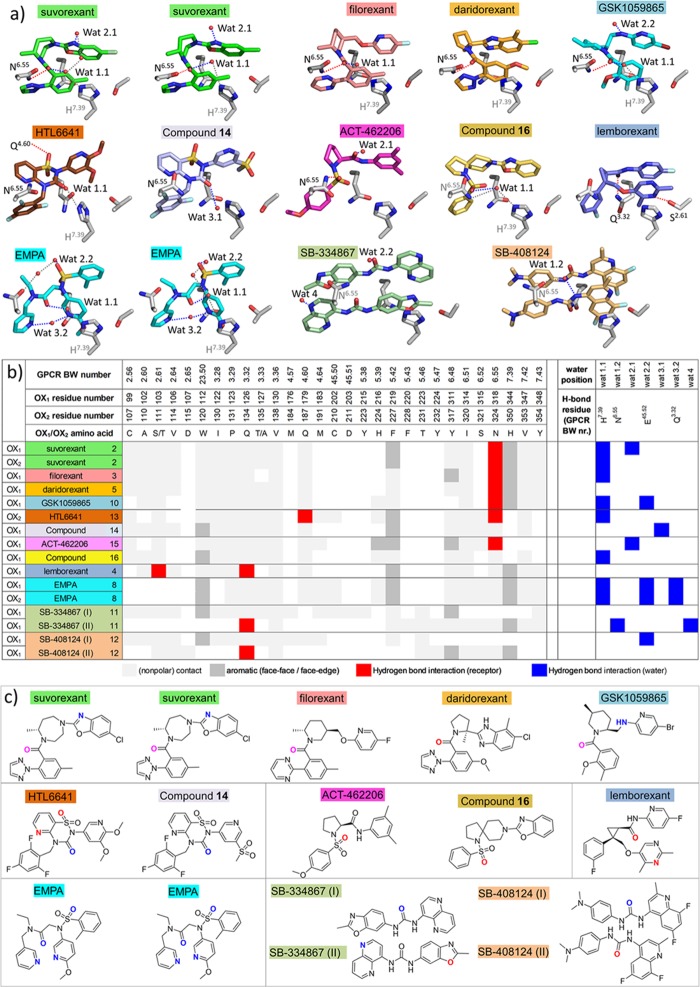
Figure 6.
Interaction analysis and water-mediated hydrogen bond networks in antagonist-bound OX1 and OX2 structures. (a) Polar interaction networks of suvorexant (2), filorexant (3), daridorexant (5), GSK1059865 (10), HTL6641 (13), pyridothiadiazinone compound 14, ACT-462206 (15), diazaspirodecane compound 16, lemborexant (4), EMPA (8), SB-334867 (11), and SB-408124 (12) in OX1, and OX2 crystal structures. Direct receptor–ligand hydrogen bond interactions, water–ligand interactions, and water–receptor hydrogen bond interactions are indicated by dashed red, blue, and gray lines, respectively. Residues and water molecules involved in hydrogen bond interactions are labeled in black, and residues involved in water-mediated interactions are labeled in gray. Water molecules involved in hydrogen bond interactions with ligands are located in four regions: (1) hydrogen bonded to H7.39 (Wat 1.1) and/or N6.55 (Wat 1.2); (2) hydrogen bonded to E45.52 (Wat 2.2) and/or close to ECL2 (Wat 2.1); (3) hydrogen bonded to Q3.32 (Wat 3.2) and/or deep in the binding pocket between TMs 2, 3, and 7 (Wat 3.1); (4) between TMs 5 and 6 (Wat 4). (b) Structural receptor–ligand and water–ligand interaction patterns in different OX1 and OX2 crystal structures, discriminating non-polar contacts (light gray), aromatic interactions (dark gray), and hydrogen bond interactions with receptor residues (red) and water molecules (blue). Water molecules are annotated as defined in panel (a). (c) Atoms in the chemical structures of the ligands depicted in panel (a) that only form direct hydrogen bond interactions with the receptor, only form water-mediated hydrogen interactions, or form hydrogen bond interactions with both the receptor and water molecules are colored red, blue, and magenta, respectively.

