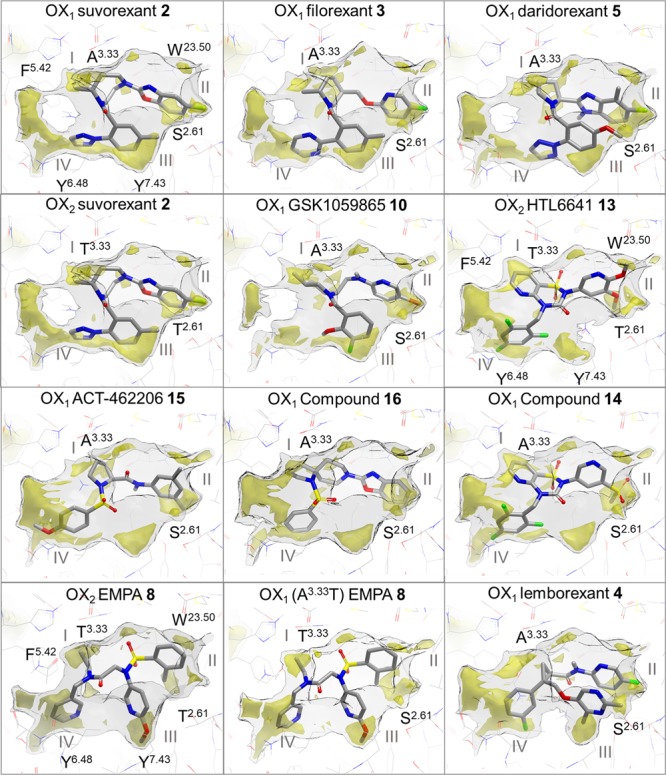
Figure 7.

Ligand binding modes in conserved lipophilic hotspots in orexin receptor crystal structures. Comparison of binding modes of suvorexant (2), filorexant (3), daridorexant (5), GSK1059865 (10), pyridothiadiazinone compound 14, ACT-462206 (15), diazaspirodecane compound 16, lemborexant (4) in OX1, suvorexant (2), EMPA (8), HTL6641 (13) in OX2, and EMPA (8) in OX1 (A1273.33T mutant). GRID maps are contoured (transparent solid) and colored in the following manner: C1 is the probe (lipophilic) in yellow at −2.8 kcal/mol, and the CH3 methyl group probe is in gray at 1 kcal/mol, which defines the pocket surface in terms of how close a ligand carbon atom can reside. Positions of residues S1032.61, W11223.50, A1273.33, F2195.42, Y3116.48, and Y3487.43 in OX1 and of T1112.61, W12023.50, T1353.33, F2275.42, Y3176.48, and Y3547.43 in OX2 are provided as reference. Whereas direct polar interactions between the chemically diverse ligands and the orexin receptor binding site are limited and not conserved (see Figure 6), all ligands target at least three of the four lipophilic hotspot regions I–IV located between A/T3.33 and F5.42 (I), S/T2.61 and W23.50 (II), S/T2.61, Y6.48 and Y7.43 (III), and F5.42 and Y6.48 (IV).
