

Abstract
Membrane models have allowed for precise study of the plasma membrane’s biophysical properties, helping to unravel both structural and dynamic motifs within cell biology. Freestanding and supported bilayer systems are popular models to reconstitute membrane-related processes. Although it is well-known that each have their advantages and limitations, comprehensive comparison of their biophysical properties is still lacking. Here, we compare the diffusion and lipid packing in giant unilamellar vesicles, planar and spherical supported membranes, and cell-derived giant plasma membrane vesicles. We apply florescence correlation spectroscopy (FCS), spectral imaging, and super-resolution stimulated emission depletion FCS to study the diffusivity, lipid packing, and nanoscale architecture of these membrane systems, respectively. Our data show that lipid packing and diffusivity is tightly correlated in freestanding bilayers. However, nanoscale interactions in the supported bilayers cause deviation from this correlation. These data are essential to develop accurate theoretical models of the plasma membrane and will serve as a guideline for suitable model selection in future studies to reconstitute biological processes.
Introduction
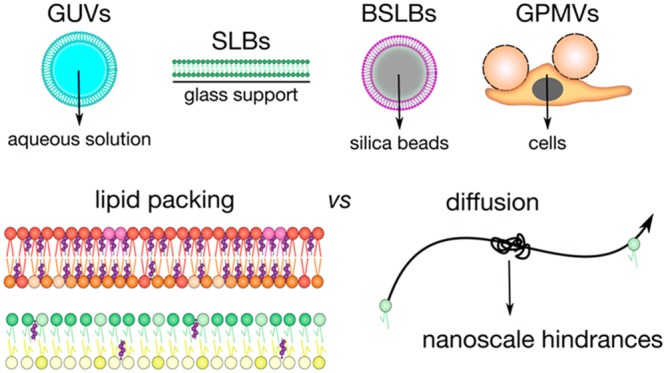
The cascades for signal transduction usually begin at the cell surface, and for this reason the plasma membrane can be considered as the main hub for cellular signaling.1 However, drawing conclusions about membrane behavior and architecture proves challenging, not least because poorly understood or still unknown processes influence its dynamics.2,3 Our current knowledge shows that plasma membrane is a vastly complex and intricate system.4 Therefore, to truly appreciate and understand the finesse behind membrane dynamics, a “bottom-up” approach to discern different processes can prove useful.5 Several systems address this, employing a basic skeleton of only the essential biological components of the plasma membrane but engineered to allow systematic incorporation of complexity.6 Such reductionist systems can not only mimic membranes but also allow membrane-associated events to be systematically broken down to reveal their key contributing species owing to their controllable compositional complexity.7 Popular models include freestanding bilayers of synthetic lipids such as giant unilamellar vesicles (GUVs)8 or membrane blebs of live cells known as giant plasma membrane vesicles (GPMVs).9,10 However, the development of solid substrates to support bilayers has also shown promise, with two prominent constructs being the planar substrate/supported lipid bilayers (SLBs)11,12 and spherical bead supported lipid bilayers (BSLBs)13,14 (also termed spherical supported lipid bilayers, SSLBs).
It is certain that membrane models will continue to aid our understanding of the dynamics that underlie cellular signaling. Though, it is worth noting that each model brings its advantages and limitations, and caution should be employed while choosing appropriate model systems for given biological processes. It is, therefore, imperative to understand how each model influences bilayer behavior, not only to best select appropriate models for future research but to also avoid drawing misleading conclusions. This necessitates comprehensive comparison between models.
Here, we directly compare the biophysical properties of GUVs, SLBs, BSLBs, and cell-derived GPMVs. We apply florescence correlation spectroscopy (FCS),15 spectral imaging,16 and super-resolution stimulated emission depletion (STED) spectroscopy17 to study the diffusivity, lipid packing, and nanoscale architecture of these membrane systems, respectively. We observed slower diffusion for SLBs and BSLBs compared to GUVs as reported in the literature previously.18 While spectral analysis revealed no difference in lipid packing within these systems, STED combined with FCS showed nanoscale hindrances within SLBs and BSLBs that would explain their comparatively slower diffusion rates despite their similar lipid packing. Moreover, we showed that changes in lipid packing and diffusion in GUVs in response to compositional changes are predictable, while support has significant influence on this relationship. This work highlights the necessity of carefully comparing membrane models to progress research in membrane biology.
Methods
Cell Lines, Lipids, and Dyes
Chinese hamster ovary (CHO) cells were cultured in DMEM/F12 (DMEM = Dulbecco’s Modified Eagle’s Medium) media supplemented with 10% fetal bovine serum (FBS) and 1% l-glutamine. Cells were prepared 2 d prior to experiments. Lipids stocks were obtained from Avanti Polar Lipids. GUV, SLB, and BSLB bilayers were prepared to contain 1% 1,2-dioleoyl-sn-glycero-3-[(N-(5-amino-1-carboxypentyl)iminodiacetic acid)succinyl] (DGS-Ni-NTA) with 1 mg/mL lipid stocks of 1,2-dioleoyl-sn-glycero-3-phosphocholine (DOPC), 1-palmitoyl-2-oleoyl-sn-glycero-3-phosphocholine (POPC), POPC:cholesterol (of varying concentrations), and 1,2-dipalmitoyl-sn-glycero-3-phosphocholine (DPPC):cholesterol (1:1), all in chloroform. Lipid stocks were stored under nitrogen at −20 °C. FCS and confocal imaging were performed with phosphatidylethanolamine (PE) labeled with Abberior Star Red (herein referred to as AbStR-PE) that is obtained by Abberior. Spectral imaging was performed with C-laurdan obtained by 2P probes.
Generation of Model Membranes
GUVs were prepared by electroformation.19,20 With this approach unilamellar vesicles between 10 and 100 μm diameters in size are produced. Lipid stock was spread onto two parallel platinum wires attached to a custom-built Teflon-coated chamber and left briefly to evaporate solvent. Wires were passed under nitrogen gas before submersion in 300 mM sucrose. Ten hertz AC current was applied to wires for 1 h to trigger vesicles swelling, followed by 2 Hz for 30 min.
GPMVs were prepared as described previously by Sezgin et al.10 Briefly, CHO cells were grown to 60% confluency, washed three times with GPMV buffer (10 mM 4-(2-hydroxyethyl)-1-piperazineethanesulfonic acid (HEPES), 2 mM CaCl2, 150 mM NaCl, pH 7.4), and then incubated at 37 °C in GPMV buffer with Paraformaldehyde (PFA) and dithiothreitol (DTT) (10 mM HEPES, 2 mM CaCl2, 150 mM NaCl, 25 mM PFA, and 2 mM DTT) for 1–2 h to stimulate membrane blebbing. The resulting supernatant containing GPMVs was then extracted.
SLBs were prepared by spin-coating.21 Briefly, glass coverslips of ϕ25 mm and #1.5 thickness were first cleaned in piranha-solution (sulfuric acid (95–98%): hydrogen peroxide (30%), 3:1) for 1 h. Cleaned coverslips were then repeatedly washed and then stored in distilled water for no longer than one week. Twenty-five microliters of 1 mg/mL of lipid stock was pipetted onto the center of a dried coverslip and immediately spun for 30 s at 3500 rpm. The coated coverslip was then placed into a metal chamber and rehydrated with 1 mL of SLB buffer to form a bilayer (150 mM NaCl, 10 mM HEPES, pH 7.4).
BSLBs were prepared from spontaneous fusion of liposomes of lipid stock with 5 μm silica beads14,22 obtained from Bangs Laboratories. Liposomes were prepared by tip sonication. Lipid stock was placed under nitrogen gas to evaporate solvent completely leaving a dry, thin lipid film. Tris buffer saline solution (50 mM Tris HCl, 150 mM NaCl, pH 8.0) (500 μL) was added to lipid residue as liposome buffer. Lipid solution was then transferred to ice and sonicated at 55 Amp for 15 min, with 10 s pulse periods separated by 10 s rest intervals. Silica beads were washed with 1 mL of phosphate-buffered solution (PBS) before centrifuging for 30 s at 2000 rpm. Supernatant was removed with residual left to prevent beads from drying, and washing was repeated twice. Beads were mixed with liposomes (1:5) and then shaken for 20 min at 1200 rpm to form BSLBs. After they were centrifuged at 2000 rpm for 30 s, BSLBs were then washed twice with PBS, with ∼500 μL solution reserved from the final wash.
Confocal Imaging
Membranes were imaged with Zeiss LSM 780 or 880 microscopes. For labeling, 20–100 ng/mL (final concentration) AbStR-PE was added to GUVs and GPMVs and incubated for 15 min. For SLBs and BSLBs, fluorescent lipid analogue was added to the lipid mixture with the ratio of 1:2000 (labeled lipid to total lipid ratio). With this way, the fluorescent probe localizes to the outer leaflet of GUVs but both leaflets of SLBs and BSLBs, and therefore the diffusion of the probe represents both leaflets for all the model systems (as our GUVs are symmetric). GUVs, BSLBs, and GPMV were transferred to Ibidi 8-well plastic chambers of #1.5 thickness. Wells were previously treated with 1 mg/mL bovine serum albumin (BSA), left for 1 h, and then washed three times with PBS or GPMV buffer before transfer. GUVs and BSLBs were then suspended in PBS. GPMVs were left unsuspended for 1 h to allow to settle for imaging. Laser (633 nm) was focused onto bilayers by 40× water immersion objective (NA 1.2) for excitation of AbStR-PE fluorophore.
Confocal and STED Fluorescence Correlation Spectroscopy (FCS)
FCS was used to measure and compare the diffusion of AbStR-PE through GUV, SLB, and BSLB models prepared with POPC, POPC:chol, and DPPC:chol compositions and GPMVs. Models were incubated with 0.05 μg/mL AbStR-PE as previously described. GUVs, BSLBs, and GPMVs were measured in Ibidi glass chambers of #1.5 thickness prepared as before. SLBs were measured on ϕ25 mm and #1.5 thickness glass cover slides.
Confocal FCS was performed on Zeiss LSM 780 microscope with 40× NA 1.2 water immersion objective. Before measurement, focal spots were calibrated using a mixture of 10 nM Alexa 488 and 647. FCS measurements were recorded with a 633 nm laser at 0.1% power (∼2 μW). Laser focusing was completed by finding axial positions of maximum fluorescence intensity at the bilayer. Correlation curves were obtained over 5 s periods with five repeats per area studied. Curves were then fitted with the freely available FoCuS-point software to extract diffusion coefficients.23 All FCS data were fitted with a two-dimensional diffusion model that incorporated an initial triplet state that describes a fixed 5 μs relaxation period. STED-FCS was performed with Leica SP8 microscope using 100× NA 1.4 oil immersion objective. All FCS measurements were done at the bottom membrane of GUVs, BSLBs, GPMVs, and SLBs to avoid refractive index mismatch. Laser focusing and data acquisition were performed as previously described.24
Spectral Imaging
Spectral imaging was used to measure and compare packing within bilayers. GUVs, BSLBs, SLBs, and GPMVs were incubated with 1 μM C-Laurdan for 10 min. GUVs, BSLBs, and GPMVs were then transferred to Ibidi plastic bottom chambers prepared as previously described. Imaging was performed by Zeiss LSM 780 microscope equipped with a 32-channel GaAsP detector array and a polarizer that minimizes photoselection effect. Laser light at 405 nm was selected for C-Laurdan excitation, and the λ-detection range was set between 415 and 691 nm. Images were analyzed with the custom generalized polarization (GP) plugin of FIJI software as described previously.16 GP was calculated with the formula:
Results and Discussion
There is already substantial evidence of a support’s influence on bilayer diffusion.25−28 To further assess the influence of support on other pivotal biophysical parameters and the relationships between them, we selected four models that broadly represent the spectrum of designs extensively utilized. Our chosen models span from freestanding GUVs to supported planar SLB and spherical BSLB constructs and to the more cellular inspired bilayer model of GPMVs (Figure 1). GUVs are freestanding vesicles, and for this reason they exhibit considerable polydispersity ranging in diameters of 10–100 μm within populations. SLBs and BSLBs are by contrast supported on substrate. Not only does the substrate confer mechanical stability, but in the case of BSLBs offers the attractive option of size tuning. While BSLBs retain a spherical construct, SLBs lack three-dimensionality and instead model the bilayer as an infinitely flat construct. In both supported models, the substrate influence on bilayer behavior, particularly its effect on diffusion, has been consistently reported.18,29 Finally GPMVs, like GUVs, are freestanding but derived from live cells.10 As a result, their membrane composition reflects native cell character but is removed from the influence of an actin cytoskeleton. We measured the diffusion and lipid packing in these four prominent bilayer models through the application of FCS, spectral imaging, and super-resolution STED spectroscopy. More importantly, we assessed the correlation between lipid packing and diffusion within different models as well as different compositions.
Figure 1.
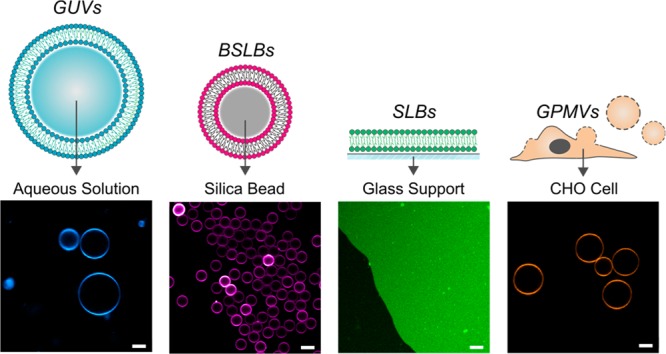
Illustrations and confocal images of membrane models. Illustrations highlight details in model designs. Confocal images were obtained at the equatorial plane of membranes labeled with AbStR-PE lipid fluorophore. All scale bars are 5 μm.
GUV Models Confirm a Relationship between Lipid Packing and Diffusivity within the Bilayer
We first considered the freestanding bilayer model of GUVs. GUVs are by definition free from a support influence and thus can reveal unbiased relationships between biophysical parameters of the bilayer. Here, we systematically altered the composition of GUVs in the form of glycerophospholipid species and cholesterol concentration with the intent of incrementally increasing bilayer ordering and seeing how this correlates with diffusion. C-Laurdan30 was incorporated into bilayers to report on lipid ordering.31 Spectral imaging16 confirmed increased ordering as compositions progressed from comprising fully unsaturated lipid (DOPC, 18:1/18:1) to monounsaturated (POPC, 16:0/18:1) and to saturated lipid (DPPC, 16:0/16:0) (Figure 2A) and increased too alongside cholesterol concentration, as expected.32,33 Extracting GP scores that quantify ordering within images revealed a monotonic increase in ordering for GUVs comprised with higher concentrations of cholesterol (Figure 2B, violin plots). We then gauged for the influence of lipid composition on bilayer diffusivity. To this end, we employed point FCS to obtain the lateral diffusion coefficients of Abberior Star Red-labeled phosphatidylethanolamine analogue incorporated within GUVs of the same compositions (Figure 2C). Diffusion measurements for GUVs agree with earlier reports for other similarly structured fluorophores (Figure 2B, box-and-whisker plots).34 Diffusion coefficients decreased with lipid saturation and also as a function of cholesterol concentration, agreeing with previous studies, and describe an approximately linear correlation.35 Overlaying respective diffusion coefficients and GP scores revealed a negative correlation between the two measures and so suggests a distinct relationship between bilayer ordering and diffusivity in GUV models (Figure 2B).
Figure 2.
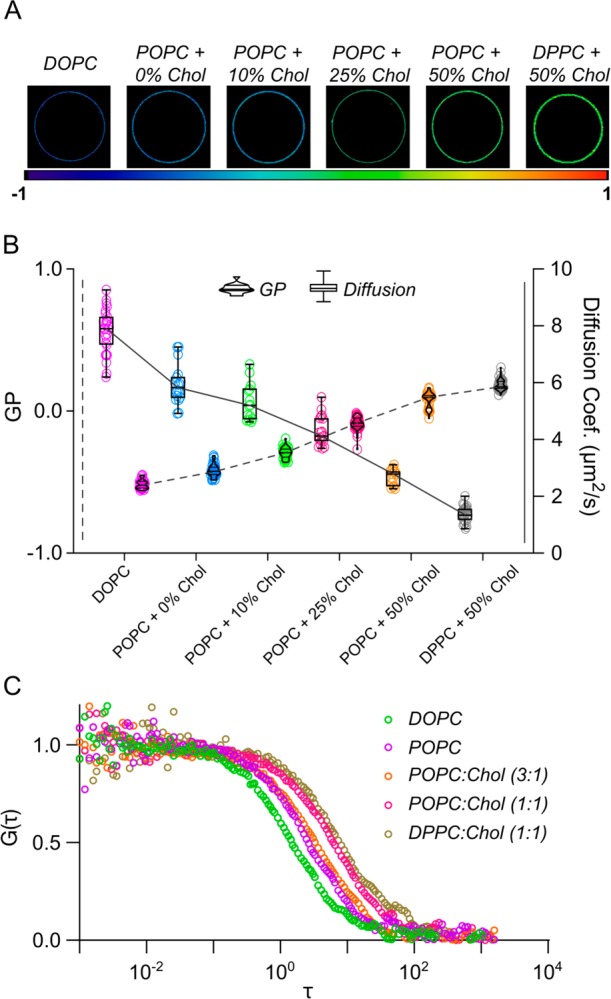
Relationship between lipid packing and diffusion in freestanding GUVs. (A) Spectral images of different GUV compositions. The color code (below images) corresponds to packing and relates to GP values, wherein higher values indicate tighter lipid packing. (B) C-Laurdan GP (violin plots) and AbStR-PE diffusion (box-and-whisker plots) measurements of GUVs across different compositions. (C) Representative FCS curves from different GUV compositions.
Diffusion in GUVs Differ from Supported Membrane Models
Having observed a clear relationship between lipid ordering and mobility in GUVs, we sought to investigate whether this relationship extended to other models. As discussed, we selected models that together broadly capture current key design motifs; herein we investigated aforementioned GUVs alongside SLBs and BSLBs of supported planar and spherical designs, respectively, as well as freestanding GPMVs that reflect the complex composition of native bilayers. First, we established diffusion profiles of all models in identical conditions for comparison. FCS was performed in models, for the interest of simplicity, composed of single-component POPC. Confocal images confirmed homogeneous fluorescence signal throughout respective bilayers at the microscopic level (Figure 1). FCS curves for all models fitted well to a one-component two-dimensional diffusion model (Figure 3A). Expectedly, diffusion coefficients measured highest in GUVs, which demonstrated an approximate threefold increase in mean diffusion coefficient over SLBs and GPMVs, with an approximate fivefold increase over BSLBs (Figure 3B). Our results generally agree with previous studies that separately demonstrated an increase in diffusion speeds in GUVs compared with in SLBs18 and GPMVs.36,37
Figure 3.

Diffusion and GP in membrane models. (A) Representative normalized point FCS curves of each membrane model composed of single-component POPC. (B) Diffusion coefficients of AbStR-PE through model bilayers. (C) GP maps of GUVs, SLBs, BSLBs, and GPMVs taken at their equatorial plane. Scale bars are 10 μm. (D) GP values of membrane models. (E) Direct comparison of GP and diffusion coefficients of POPC bilayer models and GPMVs. Violin plots and box-and-whisker plots were assigned to GP and diffusion data, respectively.
Lipid Packing and Diffusion Do Not Correlate across Different Supported Models
Having revealed the trends in diffusivity across models, we then set to investigate their lipid packing and assess for a correlation as observed previously in GUVs. Spectral imaging expectedly reported homogeneous packing within all four models, that is, no notable microscopic inhomogeneity (Figure 3C). Although statistically significant, there was, on the one hand, an extremely small difference in packing between BSLBs, SLBs, and GUVs (Figure 3D). GPMVs, on the other hand, showed higher GP values compared to all model systems (Figure 3D), presumably due to their complex lipid composition, which includes saturated lipid components and cholesterol. When we overlaid GP data with diffusion coefficients, we observed no correlation between the two, suggesting the slow diffusion trends reported within supported models is not dictated by lipid packing (Figure 3E).
STED-FCS Reveals Nanoscale Hindrances in the Architecture of Supported Models
Until this point, diffusion measurements
were performed on the diffraction-limited resolution scale, which
cannot report on nanoscale dynamics. In contrast, super-resolution
STED combined with FCS (STED-FCS) offers resolution down to 20–40
nm (Figure 4A), with
which nanoscale dynamics can be addressed.17,38 In this regard, STED can glean assessment of bilayer dynamics in
the context of surface architecture, an appreciated consideration
in supported model design.27 For instance,
unwanted aggregates or surface defects could hinder diffusion of the
fluorescent species as they travel through the observation spot and
thus yield slow diffusion that is independent of the microscopic viscosity
or lipid packing of the sample. Measuring the diffusion in a reduced
focal volume with an STED
laser allows us to distinguish free Brownian diffusion from hindered
diffusion (Figure 4A).17,38,39 A simple measurement
yielding the ratio of confocal (τC) and STED (τS) transit time through the focal spot ( ) will reveal any differences (and hence
unexpected hindrances) within the models. Nanoscale hindrances lead
to higher τS values and thus to smaller
) will reveal any differences (and hence
unexpected hindrances) within the models. Nanoscale hindrances lead
to higher τS values and thus to smaller  ratios.
Figure 4.
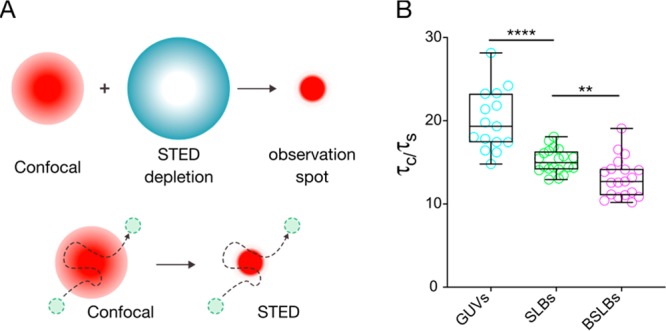
STED-FCS to reveal nanoscale hindrances in model systems. (A) Principle of STED-FCS. A super-resolved observation volume can be produced by a depletion beam (blue ring) designed with a zero-intensity center that effectively cancels surrounding emission signal from excited fluorophores. (B) Ratio of calculated confocal (τc) and STED (τs) transit times in model membranes composed of single-component POPC. A lower ratio of confocal/STED transit times suggests nanoscale hindrances.
We performed confocal FCS on model membranes composed of single-component
POPC as before, immediately followed by STED-FCS. The ratio of confocal
and STED transit times ( ) was calculated for all models (Figure 4B). GUVs demonstrated
a
) was calculated for all models (Figure 4B). GUVs demonstrated
a  value of 19.7 ± 3.7, while SLBs and
BSLBs showed 15.2 ± 1.4 and 13.1 ± 2.3, respectively. This
suggests nearly free diffusion, that is, minimal hindrance on lipid
mobility in GUVs but hindrances in SLBs and BSLBs at the nanoscale
resulting in higher τS values.
value of 19.7 ± 3.7, while SLBs and
BSLBs showed 15.2 ± 1.4 and 13.1 ± 2.3, respectively. This
suggests nearly free diffusion, that is, minimal hindrance on lipid
mobility in GUVs but hindrances in SLBs and BSLBs at the nanoscale
resulting in higher τS values.
The Relationship between Lipid Ordering and Diffusion Is Less Pronounced in Supported Models
We showed that lipid packing is comparable in bilayers of our single-component POPC models (Figure 3D), but supported models exhibit altered diffusion profiles and hint toward a “broken” relationship between ordering and diffusion in such models (Figure 3E). We sought to demonstrate how this discrepancy is affected in more ordered membrane systems by incrementally increasing ordering in GUVs, SLBs, and BSLBs. We then measured GP and diffusion and overlaid them. GP analysis of spectral images confirmed an increase in ordering as bilayer compositions changed from POPC to POPC:chol (1:1), and DPPC:chol (1:1) (Figure 5A–C). Confocal FCS measurements for each model also showed an expected trend for all models, namely, slower diffusion for more saturated membranes. (Figure 5A–C).
Figure 5.

Relationship between lipid ordering and diffusion across lipid compositions. Direct comparison of GP (violin plots) and diffusion (box-and-whisker plots) within (A) GUV, (B) SLB, and (C) BSLB models of POPC, POPC:chol, and DPPC:chol. Dotted lines indicate trends in GP, while solid lines indicate trends in diffusion. (D) Calculated fold change in mean diffusion coefficient across compositions within models. (E) Calculated unit change in mean GP value across compositions within models.
To quantitatively assess how these two parameters are correlated and to have a more comprehensive picture of the changes in diffusion and GP at different compositions, we calculated the “fold change” in diffusion (mean diffusion coefficients in POPC divided by mean diffusion coefficient in POPC:chol or DPPC:chol). Similarly, we calculated unit change in GP (mean GP in POPC:chol or DPPC:chol minus mean GP in POPC) for all model systems (Figure 5D,E). As expected, more ordered membrane systems yielded slower diffusion, and this trend was maintained in all systems (Figure 5D,E) but, importantly, to different extents. In GUVs, the differences in diffusion as well as GP (between ordered and disordered membrane systems) is the highest. This suggests that the freestanding GUV system is very sensitive to compositional changes. However, SLBs and BSLBs did not react as well to the changes in saturation. For instance, the ΔDiffusion value for DPPC:chol (i.e., mean diffusion coefficient of fluorescent lipid in POPC divided by mean diffusion coefficient of fluorescent lipid in DPPC:chol) was ∼6.5 for GUVs, while it was ∼4 and ∼3.4 for SLBs and BSLBs, respectively. In other words, diffusion in DPPC:chol GUVs is 6.5 times slower compared to POPC GUVs; however, diffusion in DPPC:chol SLBs is only 4 times slower compared to POPC SLBs (Figure 5D).
Similarly, ΔGP for DPPC:chol (i.e., mean GP in DPPC:chol minus mean GP in POPC) is ∼0.65 units for GUVs and ∼0.44 and ∼0.57 for SLBs and BSLBs, respectively. In other words, GP in DPPC:chol GUVs is 0.65 GP units higher compared to POPC GUVs; however, GP in DPPC:chol SLBs is only 0.44 units higher compared to POPC SLBs (Figure 5E). These data highlight a tight and near-linear relationship between ordering and diffusion in GUVs but not in supported membranes, which exhibit decreased sensitivity to compositional changes and deviation from the tight relationship between ordering and diffusion.
Conclusions
There is growing interest in reconstituting membrane-associated processes in vitro using model membrane systems given their proven potential to refine mechanisms and glean new hypotheses.6 However, few studies have ventured a comprehensive comparison of their biophysical properties as a function of the inherent parameters (a support presence, its material, model geometry, etc.).18,25,28,40−43 Indeed, a few studies have highlighted this concern by demonstrating altered protein functionality in different membrane models.44,45 We believe our comprehensive comparison of lipid diffusion and ordering between GUVs, planar SLBs, spherical BSLBs, and GPMVs can be a guideline for future studies that can use similar approaches for different biophysical properties.
Employing super-resolution STED-FCS, we confirmed the presence of nanoscale hindrances that seemingly influence the relationship between lipid ordering and diffusion in supported models, contrasting the linear relationship we observed in freestanding GUVs. Lipid ordering was comparable between GUVs, SLBs, and BSLBs of equal composition—at least at the microscopic scale, suggesting a more direct influence of support on diffusion. Indeed, the drag imparted by a lipid support is widely appreciated.18,27 However, our application of STED-FCS adds a spatial-temporal framework for these interactions and suggests repeated but brief interactions between support and constituting lipids. This importantly highlights the necessity of applying super-resolution techniques to better elucidate the bilayer structures and local physicochemical properties. Nanoscale surface perturbations due to the support material have also been previously appreciated to influence diffusion.27 Therefore, it is possible that nanoscale changes in surface topography of supported models effectively “slow” lateral diffusion. Our observed discrepancy with BSLBs could reflect a change of support material, in which application of other methodologies such as atomic force microscopy could prove most useful.
The influence that bilayer ordering poses over lateral mobility can essentially be explained by increased van der Waals efficiency between lipids.29,35,46,47 However, absent from previous diffusion studies is direct comparison with lipid ordering we employ here. When combined with the capacity of the GUVs to retain unhindered lipid dynamics, we were able to demonstrate a direct correlation between lipid ordering and diffusion. Indeed, this is an attractive property of GUVs; due to their lack of support, GUV diffusion is considered “free” or, more importantly, predictable. The potential of model membranes is impressive given their inherent skeletal framework, and indeed current applications prove this.6,48−50 Yet, our results highlight an unpredictability in model behavior that can accompany the incorporation of design motifs, in this case the presence of a support, and should not be overlooked in sensitive analysis.
Acknowledgments
We thank Dr. P. F. Céspedes for his help with BSLB preparations, Y. Guzel for useful discussion, and the Wolfson Imaging Centre Oxford and the Micron Advanced Bioimaging Unit (Wellcome Trust Strategic Award 091911) for providing microscope facility and financial support. We acknowledge funding by the Wolfson Foundation, the Medical Research Council (MRC, Grant No. MC_UU_12010/unit programmes G0902418 and MC_UU_12025), MRC/BBSRC/EPSRC (Grant No. MR/K01577X/1), the Wellcome Trust (Grant No. 104924/14/Z/14), and Wellcome Institutional Strategic Support Fund. E.S. is funded by the Newton-Katip Celebi Institutional Links grant (352333122) and SciLifeLab fellowship. D.B. is grateful for the support of Integrated Immunology MSc program of Univ. of Oxford. D.U. thanks Prof. I. Mlinarič-Raščan, Univ. of Ljubljana, Faculty of Pharmacy for useful scientific discussions. D.U. was supported by Slovenian Research Agency (P1-0208).
The authors declare no competing financial interest.
Special Issue
Published as part of The Journal of Physical Chemistry virtual special issue “Computational and Experimental Advances in Biomembranes”.
References
- Jacobson K.; Liu P.; Lagerholm B. C. The lateral organization and mobility of plasma membrane components. Cell 2019, 177 (4), 806–819. 10.1016/j.cell.2019.04.018. [DOI] [PMC free article] [PubMed] [Google Scholar]
- Levental I.; Veatch S. L. The continuing mystery of lipid rafts. J. Mol. Biol. 2016, 428 (24), 4749–4764. 10.1016/j.jmb.2016.08.022. [DOI] [PMC free article] [PubMed] [Google Scholar]
- Stone M. B.; Shelby S. A.; Veatch S. L. Super-resolution microscopy: shedding light on the cellular plasma membrane. Chem. Rev. 2017, 117 (11), 7457–7477. 10.1021/acs.chemrev.6b00716. [DOI] [PMC free article] [PubMed] [Google Scholar]
- Sezgin E.; Levental I.; Mayor S.; Eggeling C. The mystery of membrane organization: composition, regulation and physiological relevance of lipid rafts. Nat. Rev. Mol. Cell Biol. 2017, 18, 361–374. 10.1038/nrm.2017.16. [DOI] [PMC free article] [PubMed] [Google Scholar]
- Schwille P. Bottom-up synthetic biology: engineering in a tinkerer’s world. Science 2011, 333 (6047), 1252–1254. 10.1126/science.1211701. [DOI] [PubMed] [Google Scholar]
- Ganzinger K. A.; Schwille P. More from less - bottom-up reconstitution of cell biology. J. Cell Sci. 2019, 132 (4), jcs227488. 10.1242/jcs.227488. [DOI] [PubMed] [Google Scholar]
- Hui E.; Vale R. D. In vitro membrane reconstitution of the T-cell receptor proximal signaling network. Nat. Struct. Mol. Biol. 2014, 21 (2), 133–42. 10.1038/nsmb.2762. [DOI] [PMC free article] [PubMed] [Google Scholar]
- Angelova M. I.; Soléau S.; Méléard P.; Faucon F.; Bothorel P. Preparation of giant vesicles by external AC electric fields. Kinetics and applications. Prog. Colloid Polym. Sci. 1992, 89, 127–131. 10.1007/BFb0116295. [DOI] [Google Scholar]
- Baumgart T.; Hammond A. T.; Sengupta P.; Hess S. T.; Holowka D. A.; Baird B. A.; Webb W. W. Large-scale fluid/fluid phase separation of proteins and lipids in giant plasma membrane vesicles. Proc. Natl. Acad. Sci. U. S. A. 2007, 104 (9), 3165–70. 10.1073/pnas.0611357104. [DOI] [PMC free article] [PubMed] [Google Scholar]
- Sezgin E.; Kaiser H.-J.; Baumgart T.; Schwille P.; Simons K.; Levental I. Elucidating membrane structure and protein behavior using giant plasma membrane vesicles. Nat. Protoc. 2012, 7 (6), 1042–1051. 10.1038/nprot.2012.059. [DOI] [PubMed] [Google Scholar]
- Tamm L. K.; McConnell H. M. Supported phospholipid-bilayers. Biophys. J. 1985, 47 (1), 105–113. 10.1016/S0006-3495(85)83882-0. [DOI] [PMC free article] [PubMed] [Google Scholar]
- Richter R. P.; Berat R.; Brisson A. R. Formation of solid-supported lipid bilayers: An integrated view. Langmuir 2006, 22 (8), 3497–3505. 10.1021/la052687c. [DOI] [PubMed] [Google Scholar]
- Crites T. J.; Maddox M.; Padhan K.; Muller J.; Eigsti C.; Varma R. Supported lipid bilayer technology for the study of cellular interfaces. Curr. Protoc Cell Bio 2015, 68, 2451. 10.1002/0471143030.cb2405s68. [DOI] [PMC free article] [PubMed] [Google Scholar]
- Yokosuka T.; Kobayashi W.; Sakata-Sogawa K.; Takamatsu M.; Hashimoto-Tane A.; Dustin M. L.; Tokunaga M.; Saito T. Spatiotemporal regulation of T cell costimulation by TCR-CD28 microclusters and protein kinase C theta translocation. Immunity 2008, 29 (4), 589–601. 10.1016/j.immuni.2008.08.011. [DOI] [PMC free article] [PubMed] [Google Scholar]
- Magde D.; Elson E. L.; Webb W. W. Fluorescence correlation spectroscopy. II. An experimental realization. Biopolymers 1974, 13 (1), 29–61. 10.1002/bip.1974.360130103. [DOI] [PubMed] [Google Scholar]
- Sezgin E.; Waithe D.; Bernardino de la Serna J.; Eggeling C. Spectral imaging to measure heterogeneity in membrane lipid packing. ChemPhysChem 2015, 16 (7), 1387–94. 10.1002/cphc.201402794. [DOI] [PMC free article] [PubMed] [Google Scholar]
- Eggeling C.; Ringemann C.; Medda R.; Schwarzmann G.; Sandhoff K.; Polyakova S.; Belov V. N.; Hein B.; von Middendorff C.; Schonle A.; Hell S. W. Direct observation of the nanoscale dynamics of membrane lipids in a living cell. Nature 2009, 457 (7233), 1159–62. 10.1038/nature07596. [DOI] [PubMed] [Google Scholar]
- Przybylo M.; Sykora J.; Humpolickova J.; Benda A.; Zan A.; Hof M. Lipid diffusion in giant unilamellar vesicles is more than 2 times faster than in supported phospholipid bilayers under identical conditions. Langmuir 2006, 22 (22), 9096–9. 10.1021/la061934p. [DOI] [PubMed] [Google Scholar]
- Dimitrov D. S.; Angelova M. I. Lipid swelling and liposome formation mediated by electric fields. Bioelectrochem. Bioenerg. 1988, 19 (2), 323–336. 10.1016/0302-4598(88)80013-8. [DOI] [Google Scholar]
- Garcia-Saez A. J.; Carrer D. C.; Schwille P. Fluorescence correlation spectroscopy for the study of membrane dynamics and organization in giant unilamellar vesicles. Methods Mol. Biol. 2010, 606, 493–508. 10.1007/978-1-60761-447-0_33. [DOI] [PubMed] [Google Scholar]
- Simonsen A. C.; Bagatolli L. A. Structure of spin-coated lipid films and domain formation in supported membranes formed by hydration. Langmuir 2004, 20 (22), 9720–9728. 10.1021/la048683+. [DOI] [PubMed] [Google Scholar]
- Saliba D. G.; Cespedes-Donoso P. F.; Balint S.; Compeer E. B.; Korobchevskaya K.; Valvo S.; Mayya V.; Kvalvaag A.; Peng Y.; Dong T.; Tognoli M. L.; O’Neill E.; Bonham S.; Fischer R.; Kessler B. M.; Dustin M. L., Composition and structure of synaptic ectosomes exporting antigen receptor linked to functional CD40 ligand from helper T cells. eLife 2019, 8. 10.7554/eLife.47528 [DOI] [PMC free article] [PubMed] [Google Scholar]
- Waithe D.; Clausen M. P.; Sezgin E.; Eggeling C. FoCuS-point: software for STED fluorescence correlation and time-gated single photon counting. Bioinformatics 2016, 32, 958. 10.1093/bioinformatics/btv687. [DOI] [PMC free article] [PubMed] [Google Scholar]
- Clausen M. P.; Sezgin E.; Bernardino de la Serna J.; Waithe D.; Lagerholm B. C.; Eggeling C. A straightforward approach for gated STED-FCS to investigate lipid membrane dynamics. Methods (Amsterdam, Neth.) 2015, 88, 67–75. 10.1016/j.ymeth.2015.06.017. [DOI] [PMC free article] [PubMed] [Google Scholar]
- Otosu T.; Yamaguchi S. Effect of electrostatic interaction on the leaflet-specific diffusion in a supported lipid bilayer revealed by fluorescence lifetime correlation analysis. Phys. Chem. Chem. Phys. 2020, 22, 1242. 10.1039/C9CP05833H. [DOI] [PubMed] [Google Scholar]
- Ma C.; Srinivasan M. P.; Waring A. J.; Lehrer R. I.; Longo M. L.; Stroeve P. Supported lipid bilayers lifted from the substrate by layer-by-layer polyion cushions on self-assembled monolayers. Colloids Surf., B 2003, 28, 319. 10.1016/S0927-7765(02)00175-3. [DOI] [Google Scholar]
- Blachon F.; Harb F.; Munteanu B.; Piednoir A.; Fulcrand R.; Charitat T.; Fragneto G.; Pierre-Louis O.; Tinland B.; Rieu J.-P. Nanoroughness strongly impacts lipid mobility in supported membranes. Langmuir 2017, 33 (9), 2444–2453. 10.1021/acs.langmuir.6b03276. [DOI] [PubMed] [Google Scholar]
- Goodchild J. A.; Walsh D. L.; Connell S. D. Nanoscale substrate roughness hinders domain formation in supported lipid bilayers. Langmuir 2019, 35 (47), 15352–15363. 10.1021/acs.langmuir.9b01990. [DOI] [PubMed] [Google Scholar]
- Machan R.; Hof M. Lipid diffusion in planar membranes investigated by fluorescence correlation spectroscopy. Biochim. Biophys. Acta, Biomembr. 2010, 1798 (7), 1377–91. 10.1016/j.bbamem.2010.02.014. [DOI] [PubMed] [Google Scholar]
- Kim H. M.; Choo H.-J.; Jung S.-Y.; Ko Y.-G.; Park W.-H.; Jeon S.-J.; Kim C. H.; Joo T.; Cho B. R. A two-photon fluorescent probe for lipid raft imaging: C-laurdan. ChemBioChem 2007, 8 (5), 553–559. 10.1002/cbic.200700003. [DOI] [PubMed] [Google Scholar]
- Sezgin E.; Sadowski T.; Simons K. Measuring lipid packing of model and cellular membranes with environment sensitive probes. Langmuir 2014, 30 (27), 8160–8166. 10.1021/la501226v. [DOI] [PubMed] [Google Scholar]
- Parasassi T.; Distefano M.; Loiero M.; Ravagnan G.; Gratton E. Cholesterol modifies water concentration and dynamics in phospholipid bilayers: a fluorescence study using Laurdan probe. Biophys. J. 1994, 66 (3), 763–768. 10.1016/S0006-3495(94)80852-5. [DOI] [PMC free article] [PubMed] [Google Scholar]
- Sezgin E.; Gutmann T.; Buhl T.; Dirkx R.; Grzybek M.; Coskun U.; Solimena M.; Simons K.; Levental I.; Schwille P. Adaptive lipid packing and bioactivity in membrane domains. PLoS One 2015, 10 (4), e0123930. 10.1371/journal.pone.0123930. [DOI] [PMC free article] [PubMed] [Google Scholar]
- Ballweg S.; Sezgin E.; Doktorova M.; Covino R.; Reinhard J.; Wunnicke D.; Hanelt I.; Levental I.; Hummer G.; Ernst R. Regulation of lipid saturation without sensing membrane fluidity. Nat. Commun. 2020, 11, 756 10.1038/s41467-020-14528-1. [DOI] [PMC free article] [PubMed] [Google Scholar]
- Kahya N.; Schwille P. How phospholipid-cholesterol interactions modulate lipid lateral diffusion, as revealed by fluorescence correlation spectroscopy. J. Fluoresc. 2006, 16 (5), 671–678. 10.1007/s10895-006-0108-6. [DOI] [PubMed] [Google Scholar]
- Pinkwart K.; Schneider F.; Lukoseviciute M.; Sauka-Spengler T.; Lyman E.; Eggeling C.; Sezgin E. Nanoscale dynamics of cholesterol in the cell membrane. J. Biol. Chem. 2019, 294 (34), 12599–12609. 10.1074/jbc.RA119.009683. [DOI] [PMC free article] [PubMed] [Google Scholar]
- Schneider F.; Waithe D.; Clausen M. P.; Galiani S.; Koller T.; Ozhan G.; Eggeling C.; Sezgin E. Diffusion of lipids and GPI-anchored proteins in actin-free plasma membrane vesicles measured by STED-FCS. Mol. Biol. Cell 2017, 28 (11), 1507–1518. 10.1091/mbc.e16-07-0536. [DOI] [PMC free article] [PubMed] [Google Scholar]
- Sezgin E.; Schneider F.; Galiani S.; Urbancic I.; Waithe D.; Lagerholm B. C.; Eggeling C. Measuring nanoscale diffusion dynamics in cellular membranes with super-resolution STED-FCS. Nat. Protoc. 2019, 14, 1054. 10.1038/s41596-019-0127-9. [DOI] [PubMed] [Google Scholar]
- Mueller V.Nanoscale studies of membrane dynamics via STED - fluorescence correlation spectroscopy ;University Heidelberg, 2012. [Google Scholar]
- Oppenheimer N.; Diamant H. In-plane dynamics of membranes with immobile inclusions. Phys. Rev. Lett. 2011, 107 (25), 258102. 10.1103/PhysRevLett.107.258102. [DOI] [PubMed] [Google Scholar]
- Camley B. A.; Lerner M. G.; Pastor R. W.; Brown F. L. Strong influence of periodic boundary conditions on lateral diffusion in lipid bilayer membranes. J. Chem. Phys. 2015, 143 (24), 243113. 10.1063/1.4932980. [DOI] [PMC free article] [PubMed] [Google Scholar]
- Houser J. R.; Busch D. J.; Bell D. R.; Li B.; Ren P.; Stachowiak J. C. The impact of physiological crowding on the diffusivity of membrane bound proteins. Soft Matter 2016, 12 (7), 2127–2134. 10.1039/C5SM02572A. [DOI] [PMC free article] [PubMed] [Google Scholar]
- Tero R.; Sazaki G.; Ujihara T.; Urisu T. Anomalous diffusion in supported lipid bilayers induced by oxide surface nanostructures. Langmuir 2011, 27, 9662. 10.1021/la201474h. [DOI] [PubMed] [Google Scholar]
- Shen H.-H.; Lithgow T.; Martin L. Reconstitution of membrane proteins into model membranes: seeking better ways to retain protein activities. Int. J. Mol. Sci. 2013, 14 (1), 1589–1607. 10.3390/ijms14011589. [DOI] [PMC free article] [PubMed] [Google Scholar]
- Sanchez M. F.; Levi V.; Weidemann T.; Carrer D. C. Agonist mobility on supported lipid bilayers affects Fas mediated death response. FEBS Lett. 2015, 589 (23), 3527–33. 10.1016/j.febslet.2015.10.009. [DOI] [PubMed] [Google Scholar]
- Kahya N.; Scherfeld D.; Schwille P. Differential lipid packing abilities and dynamics in giant unilamellar vesicles composed of short-chain saturated glycerol-phospholipids, sphingomyelin and cholesterol. Chem. Phys. Lipids 2005, 135 (2), 169–180. 10.1016/j.chemphyslip.2005.02.013. [DOI] [PubMed] [Google Scholar]
- Lindblom G.; Oradd G. Lipid lateral diffusion and membrane heterogeneity. Biochim. Biophys. Acta, Biomembr. 2009, 1788 (1), 234–244. 10.1016/j.bbamem.2008.08.016. [DOI] [PubMed] [Google Scholar]
- Jenkins E.; Santos A. M.; O’Brien-Ball C.; Felce J. H.; Wilcock M. J.; Hatherley D.; Dustin M. L.; Davis S. J.; Eggeling C.; Sezgin E. Reconstitution of immune cell interactions in free-standing membranes. J. Cell Sci. 2019, 132, jcs219709. 10.1242/jcs.219709. [DOI] [PMC free article] [PubMed] [Google Scholar]
- Tanaka M.; Sackmann E. Polymer-supported membranes as models of the cell surface. Nature 2005, 437 (7059), 656–663. 10.1038/nature04164. [DOI] [PubMed] [Google Scholar]
- Hui E. Understanding T cell signaling using membrane reconstitution. Immunol. Rev. 2019, 291 (1), 44–56. 10.1111/imr.12767. [DOI] [PubMed] [Google Scholar]