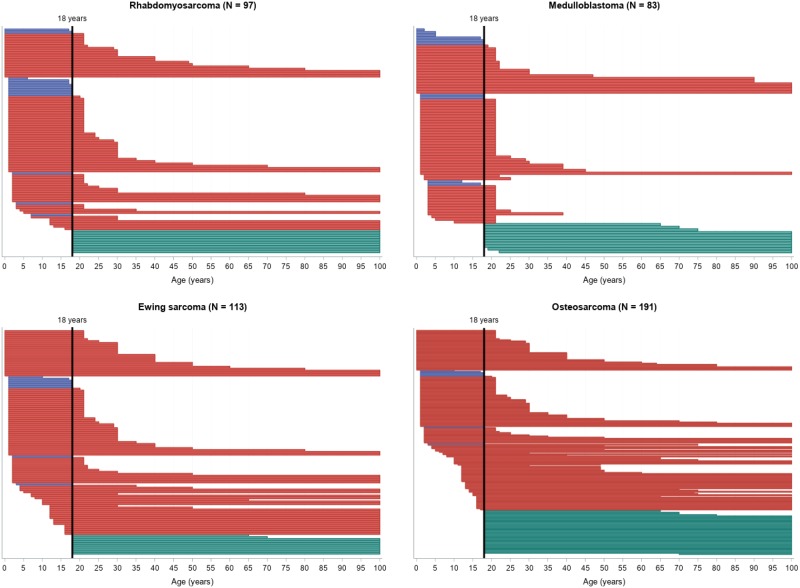
Figure 4.
Swimmer-like plot for the range of age inclusion. Each bar represents one trial: blue bars correspond to pediatric trials, red bars to transitional, and green bars to adult trials. Note that the length and location of each bar (in relation to the x-axis) depends on the range of the allowed inclusion age for that particular trial. For example, a trial that enrolls patients from 18 years of age to 100 years of age would start at the highlighted, vertical 18-year line and end at the right margin of the plot. The width of the bars is proportional to the number of trials included for each tumor type for visibility reasons.

