Figure 1.

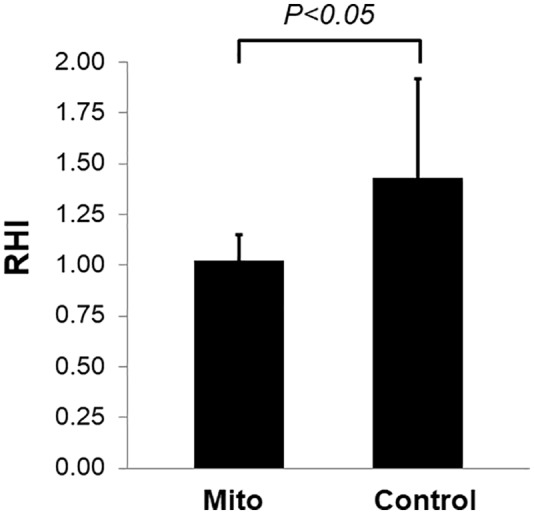
RHI in individuals with mitochondrial diseases and controls. The bars represent the mean (n = 9) and the vertical lines above the bars represent the positive SD. RHI indicates reactive hyperemic index.

RHI in individuals with mitochondrial diseases and controls. The bars represent the mean (n = 9) and the vertical lines above the bars represent the positive SD. RHI indicates reactive hyperemic index.