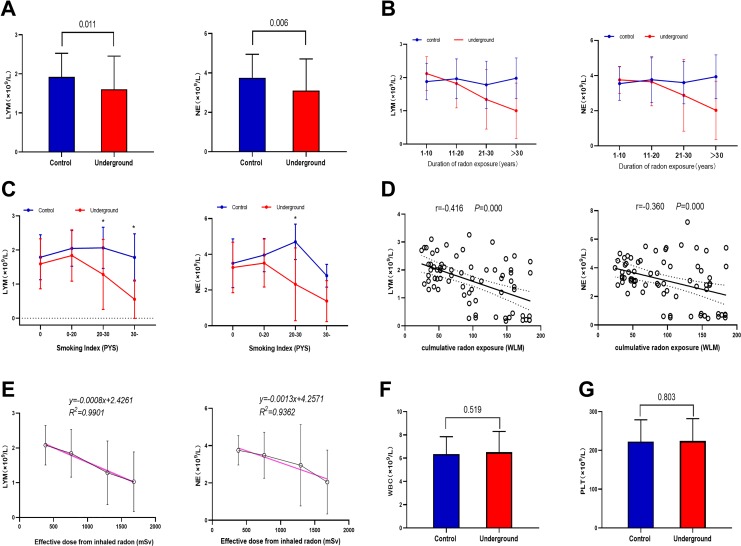
Figure 1.
Analysis of hematological parameters. A, Comparison of lymphocyte count (LYM) and neutrophil count (NE) in peripheral venous blood between the 2 groups of miners. B, Changes in LYM and NE with duration of radon exposure. Data represent mean ± standard deviation. C, Changes in LYM and NE across Smoking Index subgroups (0, ≤20, ≤30, and >30; Table 1). D, Significant and negative correlations between cumulative radon exposure and LYM or NE. Pearson correlation coefficients and P values were calculated. E, Dose–response relationship between effective dose from inhaled radon and LYM or NE in the underground group. The red regression lines represent the best fitting linear dose–response relationships. Comparison of (F) white blood cell count (WBC) and (G) platelet count (PLT) between the 2 groups of miners, showing no significant differences.

