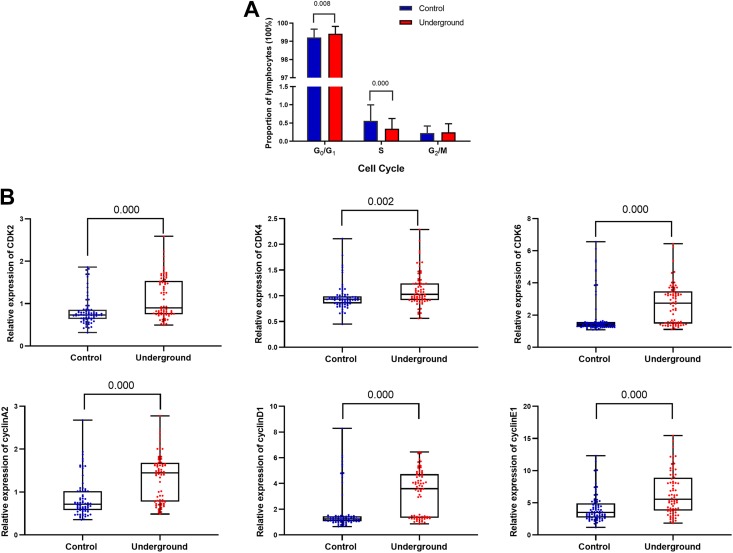
Figure 2.
Changes in the cell cycle phases and regulatory proteins in lymphocytes in the underground and control groups. A, Comparison of lymphocyte cell cycle phases between the 2 groups. Data represent median (n = 72 per group). P values were calculated using the Wilcoxon test. B, Comparison of relative expression of cell cycle regulatory proteins in the peripheral blood lymphocytes (detected by flow cytometry) between the 2 groups. Data represent median (n = 72 per group). P values were calculated using the Wilcoxon test.

