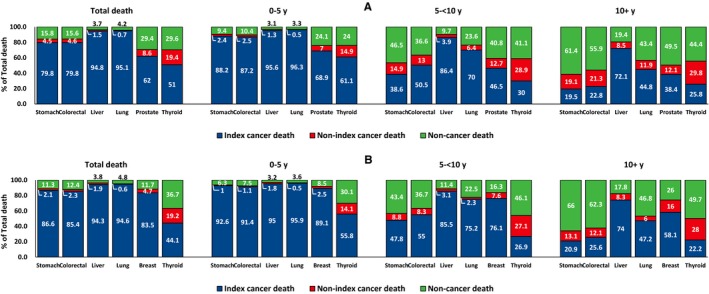
Figure 3.

Proportionate mortality of (A) male and (B) female cancer patients with primary cancer of selected sites diagnosed between 2000 and 2016, stratified by time since cancer diagnoses. Note. 100% indicates the number of total deaths among cancer patients in each time period. The time of death was divided into <5 y after cancer diagnosis, from 5 to 10 y after cancer diagnosis and ≥10 y after cancer diagnosis
