Figure 1.

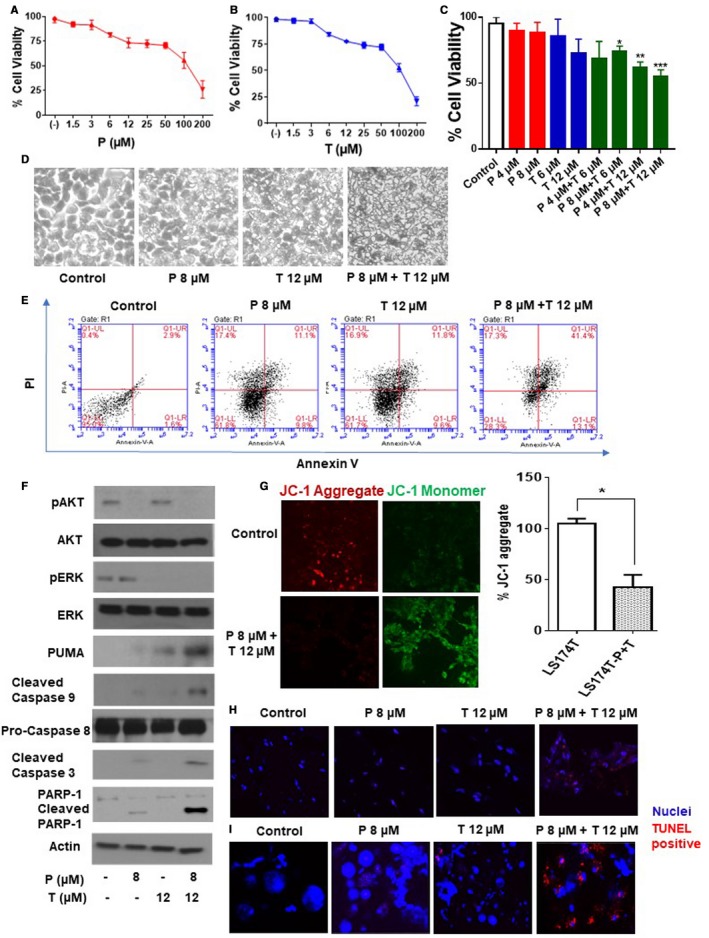
Combination of pictilicsib and trametinib induced synergistic cytotoxicity and apoptosis in vitro. LS174T cells were treated with trametinib (T) alone (0‐200 µmol/L) (A), pictilisib (P) alone (0‐200 µmol/L) (B), or combination of P (0‐8 µmol/L) and T (0‐12 µmol/L) for 24 h (C), following which cell viability was analyzed by MTS assay. Combination index (CI) for combination treatment (P 8 µmol/L + T 12 µmol/L) in (C) was calculated using computer software Compusyn. LS174T cells were treated with single or dual drug therapy for 24 h following which apoptotic cells were analyzed by phase contrast microscope (D) and flow cytometry (Annexin V/PI staining) (E) at 24 h. Following treatment of LS174T cells with single or dual drugs, signaling pathway molecules (AKT, ERK) and apoptotic marker proteins (caspase 3/8/9, PARP‐1, and PUMA) were measured using western blot assay (F). LS174T cells were treated with combination of P 8 µmol/L + T12 µmol/L for 24 h and stained with JC‐1. Diffuse green JC1‐monomers indicate mitochondrial depolarization (damage), and punctate red JC1‐aggregates indicate intact mitochondrial membrane potential (ΔΨm). Percentage (%) JC‐1 aggregate staining was quantified. Confocal images were randomly taken of 10 different fields and analyzed using Image J Software to quantify the average intensity of the protein expression (G). Human tumor explant cultures (H) and colonoid cultures (I) were treated with single or dual drug therapy for 24 h and apoptosis was measured by TUNEL assay. Blue color represents nuclei and red color represents TUNEL positive cells. Error bars represents standard deviation (SD) from triplicate experiments (*P < .05, **P < .01, ***P < .001)
