Figure 7.

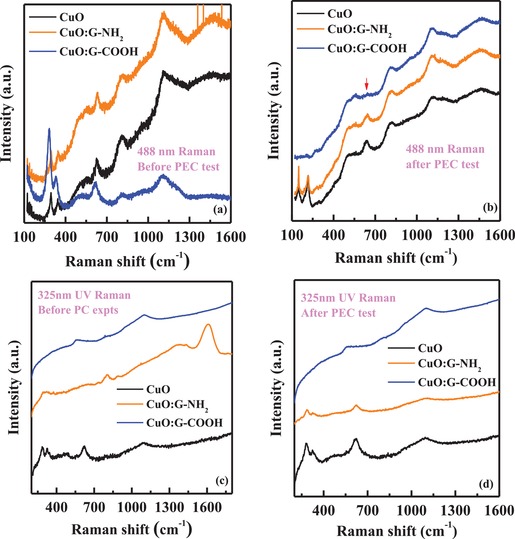
Raman spectra recorded from the samples before and after PEC studies. a,b) Spectra with 488 nm visible Raman excitation. c,d) Spectra with 325 nm UV Raman excitation from three sets of samples (CuO, CuO:G‐NH2, and CuO:G‐COOH).

Raman spectra recorded from the samples before and after PEC studies. a,b) Spectra with 488 nm visible Raman excitation. c,d) Spectra with 325 nm UV Raman excitation from three sets of samples (CuO, CuO:G‐NH2, and CuO:G‐COOH).