
Figure 2.
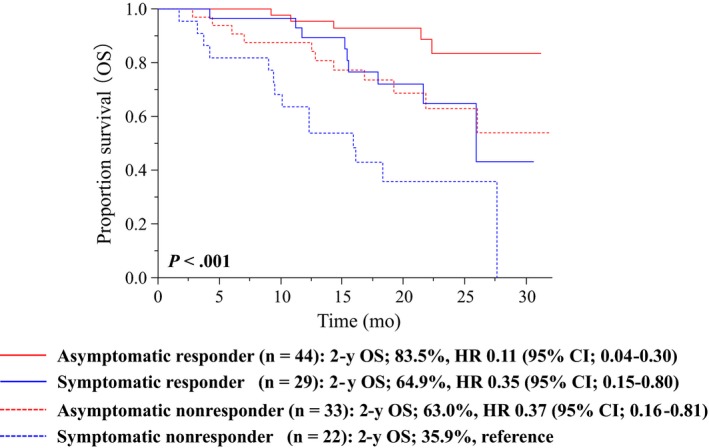
The Kaplan‐Meier curves of OS in combined baseline symptoms and treatment response status. Among asymptomatic patients with data of treatment efficacy (n = 77), 44 and 33 were treatment responders and nonresponder, respectively. Among symptomatic patients (n = 51), 29 and 22 patients were treatment responders and nonresponder, respectively