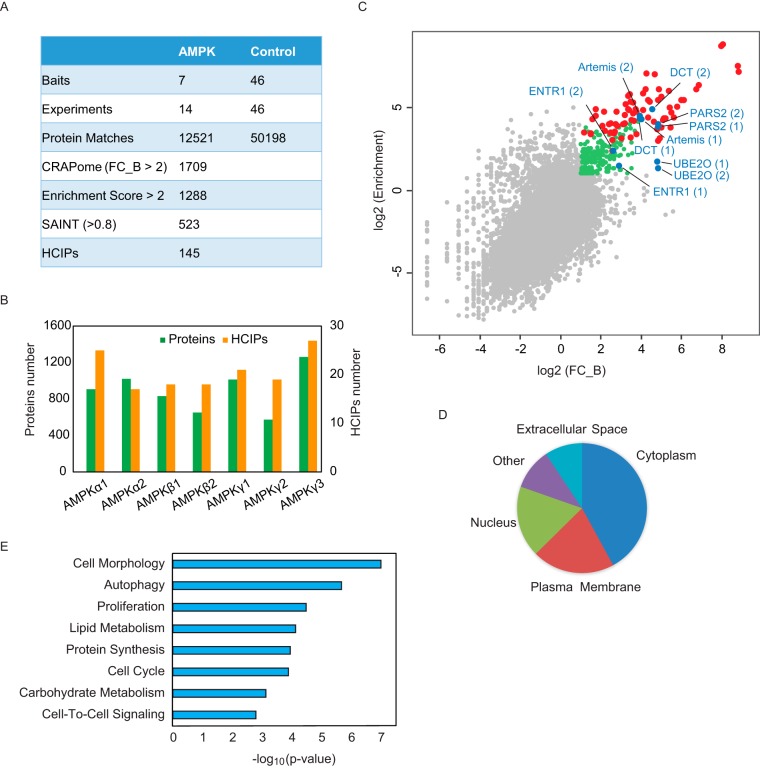
Fig. 2.
Overview of the TAP-MS results for AMPK complexes. A, Summary of TAP-MS identification and data filtration. We performed two biological repeats for each AMPK subunit. Forty-six TAP-MS results underwent HCIP analysis using non-related baits as controls. The final HCIPs are the common genes obtained from all three HCIP filtration strategies. B, Total identified proteins and corresponding HCIPs for each AMPK subunit. C, The correlation between two different HCIP analysis strategies, CRAPome and enrichment analysis. The red dots are the identified AMPK subunits; the blue dots are the subunits selected for further validation; the green dots are the genes that passed both CRAPome and enrichment filtrations; and the gray dots are nonspecific binding proteins. D, Localization analysis for the HCIPs of AMPK subunits. E, Annotation of HCIPs using Ingenuity Pathway Analysis software.

