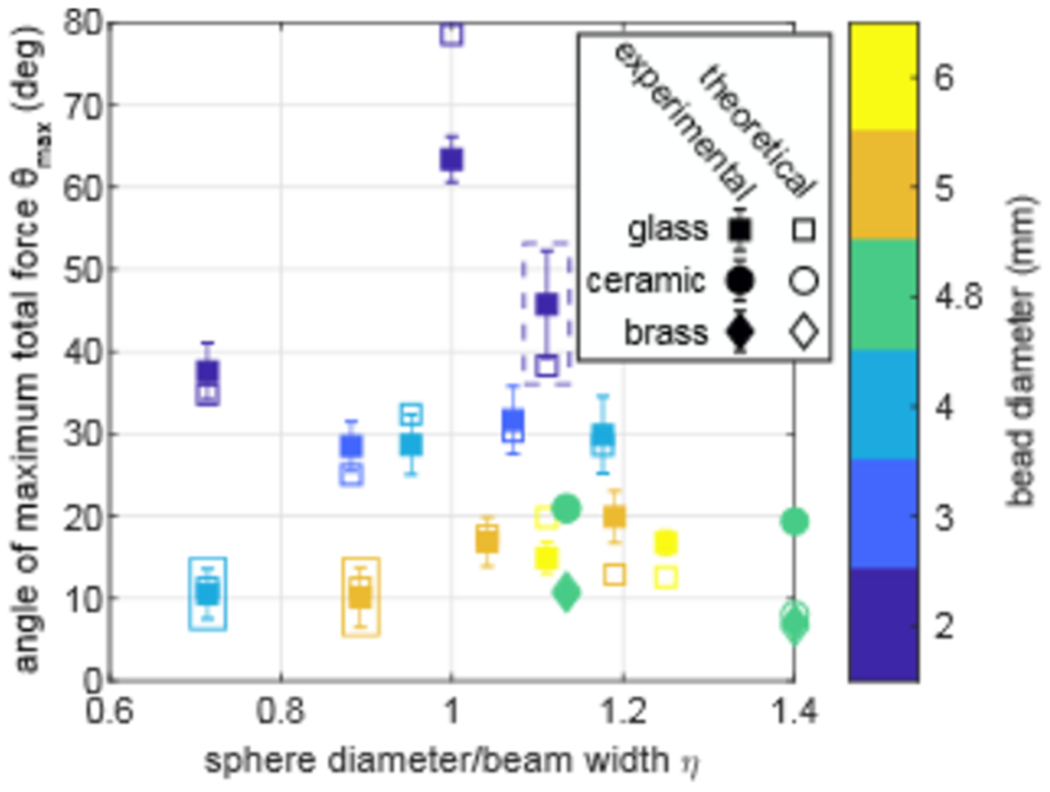
FIG. 5.

Comparison between the measured and calculated predicted angle θmax versus the ratio of sphere diameter to beam width η. Experimental data are the mean, and error bars show the standard deviation of ten replicate measurements. Close proximity of solid and open marks shows the good agreement between measurement and theory over a range of bead sizes and compositions. Different compositions are denoted by different data point shapes. Data point pairs within the dashed rectangle are for the π-radial beam and within the solid rectangle are for the 2π-radial beam, which both have a fixed beam width. Sphere diameters are shown by color, and M was adjusted to alter the beam width and create the η displayed. Overall calculations with the SB model compare well to measurement for different beams, sphere diameters, and sphere compositions.
