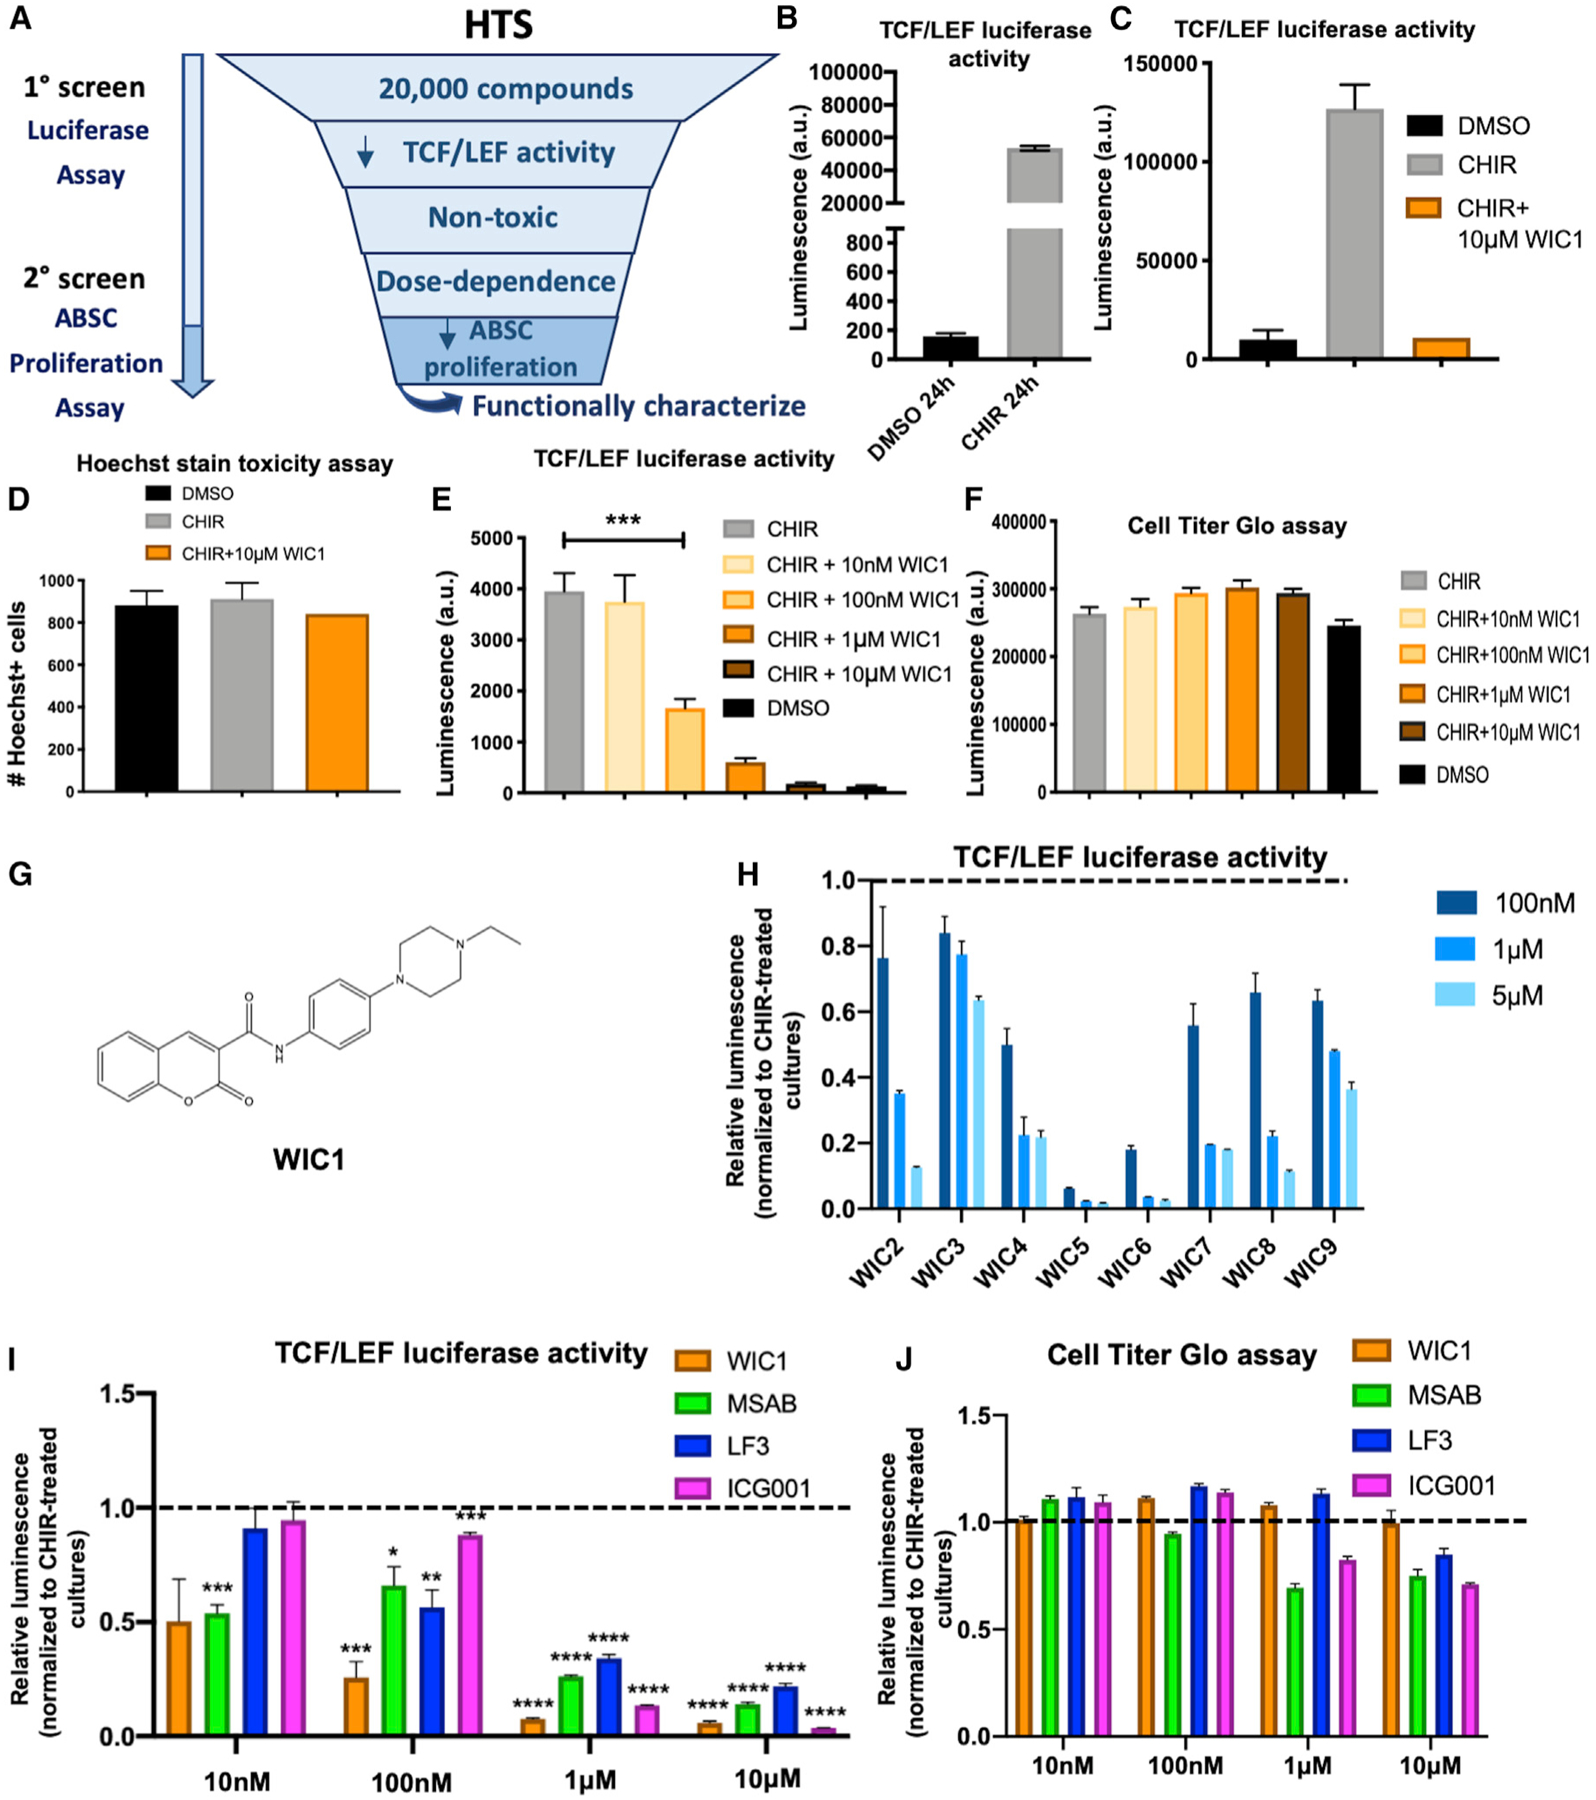
Figure 3. High-Throughput Drug Screening Identifies a Small-Molecule Inhibitor of Canonical Wnt Signaling.

(A) High-throughput screen (HTS) schema to identify small molecule inhibitors of Wnt signaling.
(B) Bar graph representing BEAS2B TCF/LEF luciferase reporter activity treated with DMSO or CHIR for 24 h used for HTS.
(C) Bar graph representing BEAS2B TCF/LEF luciferase reporter activity treated with DMSO, CHIR, or CHIR + WIC1 after 24 h from HTS.
(D) Bar graph representing percentage of viable, nontoxic BEASB cells measured by Hoechst staining treated with DMSO, CHIR, or CHIR + WIC1 from HTS.
(E) Bar graph representing BEAS2B TCF/LEF luciferase reporter activity treated with DMSO, CHIR, or CHIR with varying concentrations of WIC1 for 24 h.
(F) Bar graph representing CellTiter-Glo assay in BEAS2B cells treated with DMSO, CHIR, or CHIR with varying concentrations of WIC1.
(G) Structure of WIC1.
(H) Bar graph representing BEAS2B TCF/LEF luciferase reporter activity treated with CHIR and varying concentrations of WIC2–WIC9 from SAR studies. Data are normalized to CHIR-treated cultures, indicated by the dotted line.
(I) Bar graph representing BEAS2B TCF/LEF luciferase reporter activity treated for 24 h with 5 μM CHIR or 5 μM CHIR plus indicated concentrations of WIC1, MSAB, LF3, or ICG001. Data are normalized to CHIR-treated cultures, indicated by the dotted line.
(J) Bar graph representing the CellTiter-Glo assay in BEAS2B cells treated for 24 h with 5 μM CHIR or 5 μM CHIR plus indicated concentrations of WIC1, MSAB, LF3, or ICG001. Data are normalized to CHIR-treated cultures, indicated by the dotted line (n = 3–6).
*p < 0.05, **p < 0.01, ***p < 0.001, and ****p < 0.0001 by Student’s t test. All error bars represent mean ± SEM.
