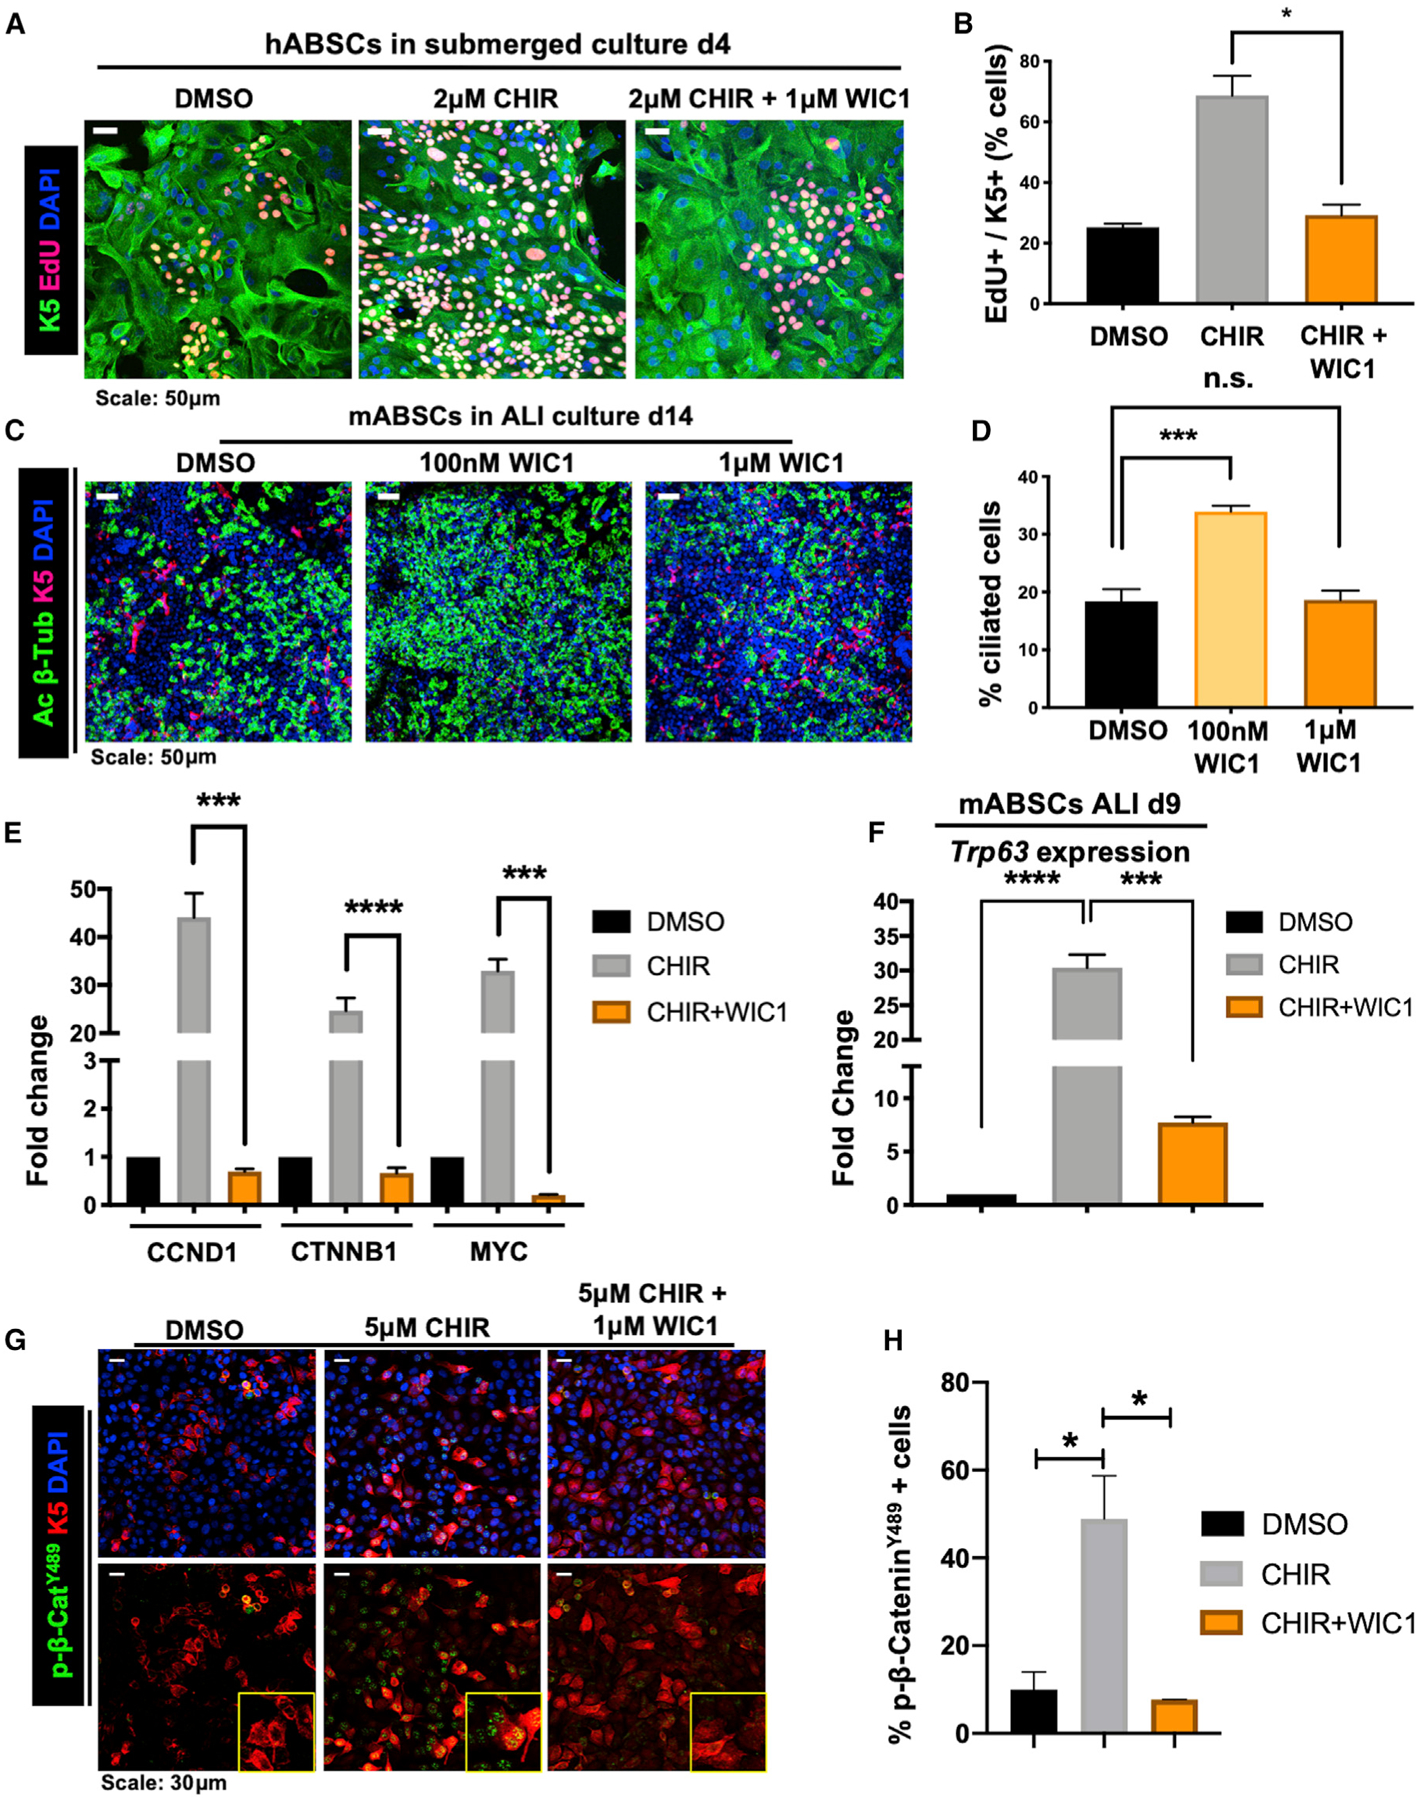
Figure 4. WIC1 Inhibits Wnt-Induced ABSC Hyperproliferation, Promotes Ciliated Cell Differentiation, and Acts by Decreasing Nuclear p-β-CateninY489.

(A) IF images of mABSCs in vitro under submerged conditions on day 4 treated with DMSO, CHIR, or CHIR+WIC1 using click-iT EdU assay.
(B) Quantification of K5+ EdU+ mABSCs under submerged conditions on day 4 treated with DMSO, CHIR, or CHIR+WIC1. 3 fields of each treatment used for quantification.
(C) IF images of mABSCs in vitro under ALI culture conditions for 14 days treated with DMSO or indicated concentrations of WIC1.
(D) Quantification of percentage of ciliated cells from mABSC cultures under ALI conditions for 14 days treated with DMSO or indicated concentrations of WIC1. Four fields of each treatment were used for quantification.
(E) Bar graph representing qPCR data assessing mRNA expression of CCND1, CTNNB1, and MYC in BEAS2B cells treated with DMSO, 5 μM CHIR, or 5 μM CHIR + 1 μM WIC1 for 48 h.
(F) Bar graph representing qPCR data assessing mRNA expression of Trp63 in mABSCs treated with DMSO, 1 μM CHIR, or 1 μM CHIR + 1 μM WIC1 on ALI culture day 9.
(G) IF images for p-β-cateninY489 from BEAS2B cells treated with DMSO, 5 μM CHIR, or 5 μM CHIR + 1 μM WIC1 for 24 h. Yellow boxes show magnified inlets of the indicated treatment.
(H) Quantification of percentage of p-β-cateninY489+ BEAS2B cells treated with DMSO, 5 μM CHIR, or 5 μM CHIR + 1 μM WIC1 for 24 h. Three fields of each treatment were used for quantification (n = 3–6).
*p < 0.05, **p < 0.01, ***p < 0.001, and ****p < 0.0001 by Student’s t test. All error bars represent mean ± SEM.
