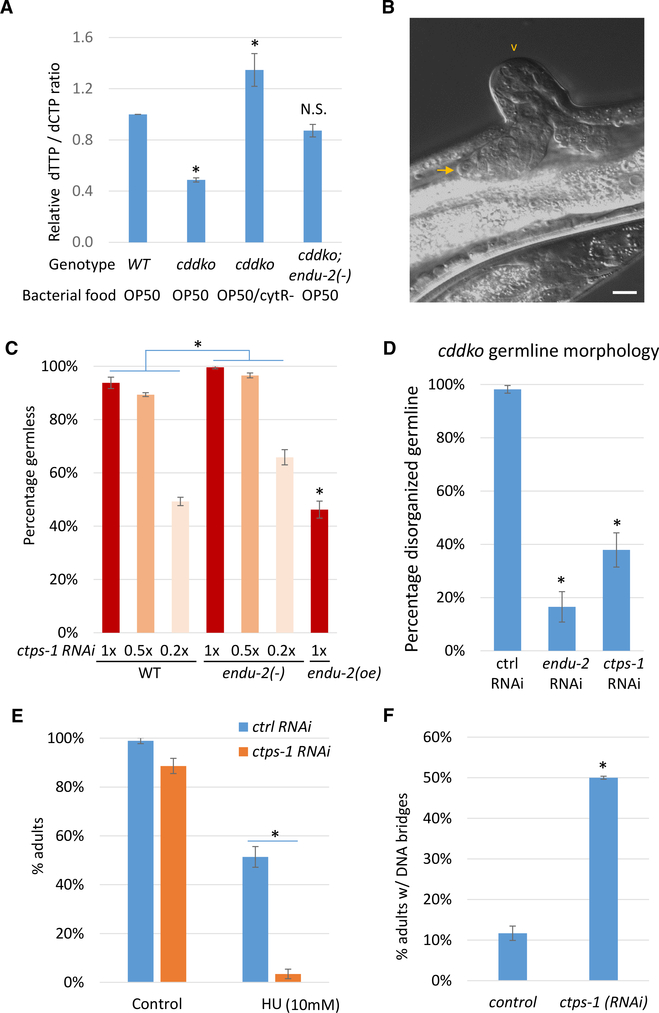
Figure 2. endu-2 Acts with ctps-1 to Regulate NT Homeostasis.
(A) Bar graphs showing that the low dTTP:dCTP ratio in cddko mutants is significantly suppressed by endu-2(−). The cytR− mutation in E. coli alters NT metabolism and increases the pyrimidine level (Chi et al., 2016). Error bars, standard deviation. Asterisks indicate significant differences. N.S., not significant. Tukey’s range test, FWER = 0.01.
(B) A representative image of the “germless” phenotype of ctps-1(RNAi). The arrow points to the tip of the small germline. The arrowhead points to a commonly observed ventral protrusion of the vulva. The scale bar represents 10 μm.
(C) Percentage of worms showing the germless phenotype on varying dilutions of ctps-1 RNAi. RNAi dilution was done by mixing ctps-1(RNAi) bacteria with control RNAi bacteria. While endu-2(−) enhanced the defect of ctps-1(RNAi), endu-2 overexpression (oe) suppressed the defect. n = 2 (~200 worms each). Error bars, standard deviation. Asterisks indicate significant differences. Two-way ANOVA test was used to compare the response of WT and endu-2(−) to the serial dilution of ctps-1 RNAi. Two-tailed, unpaired Student’s t test was used to compare the response of WT and endu-2(oe) to undiluted ctps-1 RNAi. Bonferroni correction was applied, with α = 0.0024.
(D) Percentage of cddko worms showing disorganized germlines. RNAi of either endu-2 or ctps-1 suppressed the germline defect in cddko worms. Equal concentrations of RNAi bacteria (pyrimidine rich) and OP50 (pyrimidine poor) were mixed together and fed to worms to create a sensitized background.
(E) Percentage of worms reaching adulthood after 3 days with or without HU treatment, indicating that ctps-1(RNAi) worms are highly sensitive to HU.
(F) ctps-1(RNAi) adults had an increased number of DNA bridges in their intestines. Error bars in (D)–(F) represent standard deviation. Asterisks indicate significant differences.
In (D), Tukey’s range test, FWER = 0.01. In (E) and (F), Student’s t test, unpaired, two-tailed. Bonferroni correction was applied in €. α = 0.008 (E) and 0.01(F).

