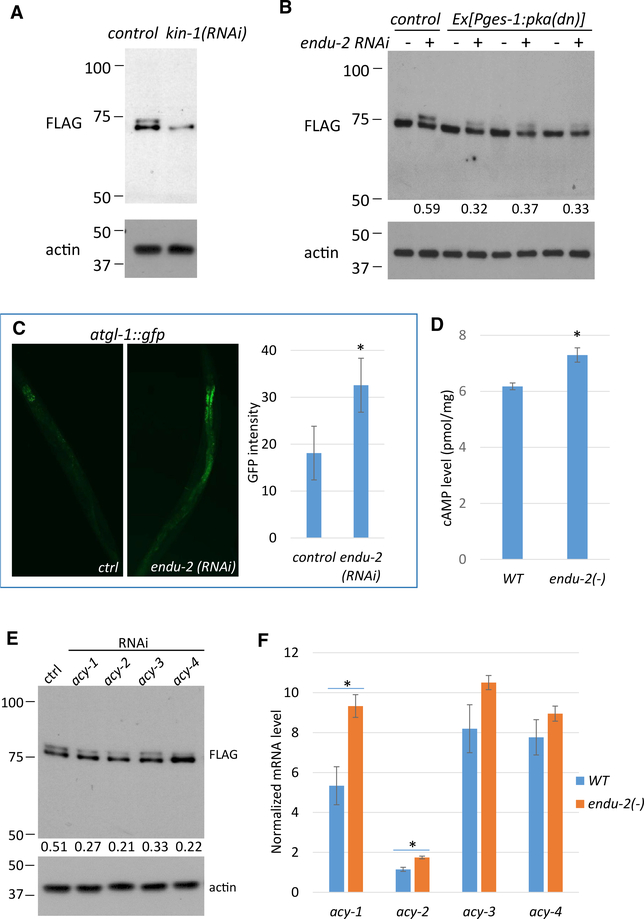
Figure 4. ENDU-2 Regulates CTPS-1 Phosphorylation through the PKA Pathway in the Intestine.
(A) Western blot of the FLAG-tagged CTPS-1 protein. kin-1 RNAi eliminates CTPS-1 phosphorylation.
(B) Expressing dominant-negative PKA in the intestine reduced CTPS-1 phosphorylation. Numbers below the blot indicate the relative signal intensity between the upper and lower CTPS-1 band in each sample.
(C) GFP fluorescence image and quantitative data for the atgl-1::gfp reporter. Expression increased in endu-2(RNAi) animals.
(D) The whole-worm cAMP level was increased in endu-2(−) mutants.
(E) RNAi of acy genes reduced CTPS-1 phosphorylation. Numbers show the relative signal intensity between the upper and lower CTPS-1 bands in each sample.
(F) qPCR results for mRNA levels of the acy genes in WT or endu-2(−) worms. Error bars indicate standard deviation and asterisks indicate significant differences in all panels.
For (C) and (D), Student’s t test, unpaired, two-tailed, α = 0.01. For (F), Student’s t test, unpaired, 2-tailed with Bonferroni correction, α = 0.0018.

