
Figure 1.
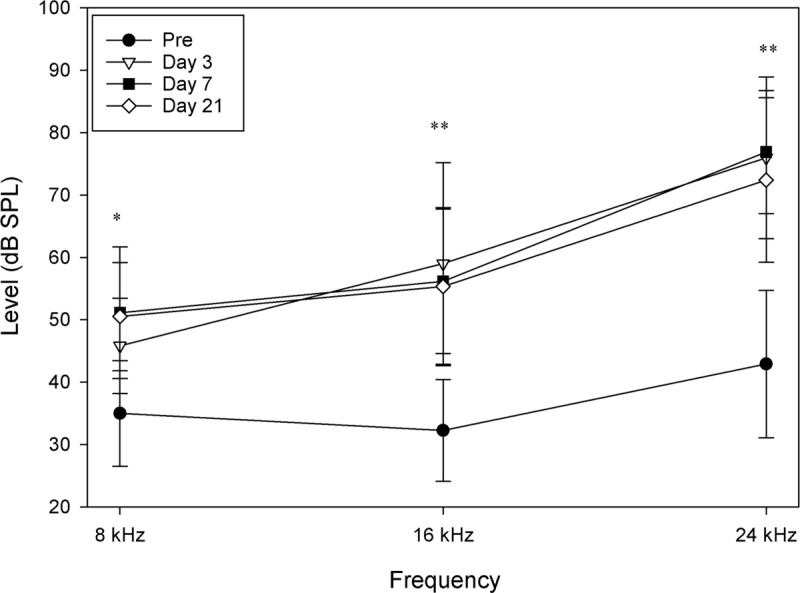
ABR thresholds for the mice before and after impulse noise exposure. Error bars represent ± 1 standard deviation. N = 31 for Pre, Day 3, and Day 7. N = 29 for Day 21. Significant differences between Pre and all other days as well as between Day 3 and Day 21 are shown with an asterisk (*). Significant differences only between Pre and all other days are shown with two asterisks (**).