
Figure 2.
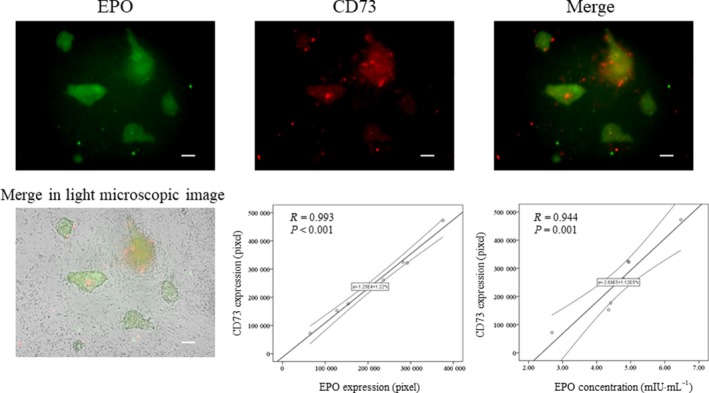
Correlation between EPO and CD73 expression. EPO and CD73 expressions were evaluated by immunocytochemistry. The hiPSC‐EPO cells were stained with anti‐EPO (green) and anti‐CD73 antibodies (red). The white bar indicates 100 µm. The P‐values were determined by Pearson's tests.