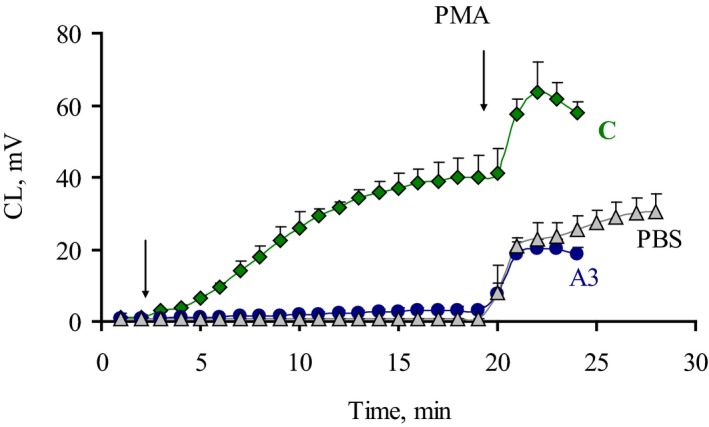
Figure 2.

Time development and phorbol ester (PMA) stimulation effect on CL responses of blood neutrophils stimulated by E. coli. Typical time curves for PBS and isolates with low (A3) and high (C) CL values are shown, moments of stimulant addition indicated by arrows. Error bars represent SD.
