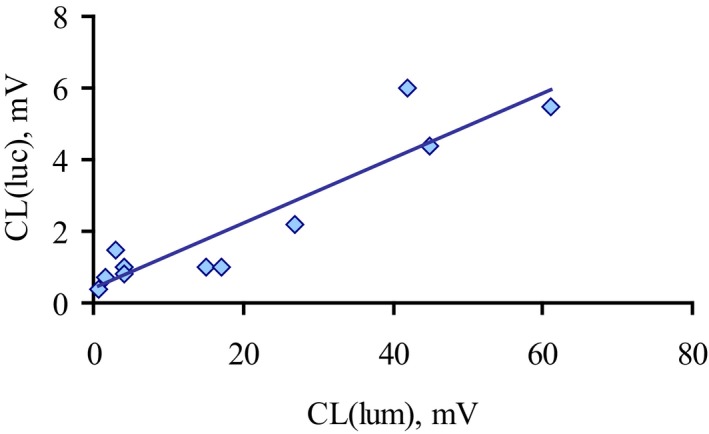
Figure 3.

Correlation between luminol and lucigenin‐enhanced chemiluminescence of neutrophils stimulated by E. coli isolates from CD patients (n = 12). Luminol‐enhanced CL response of neutrophils in whole blood (CL (lum)) is plotted versus superoxide‐sensitive lucigenin‐enhanced CL (luc). Correlations were calculated by the Pearson method (r = 0.8, P < 0.05, n = 12).
