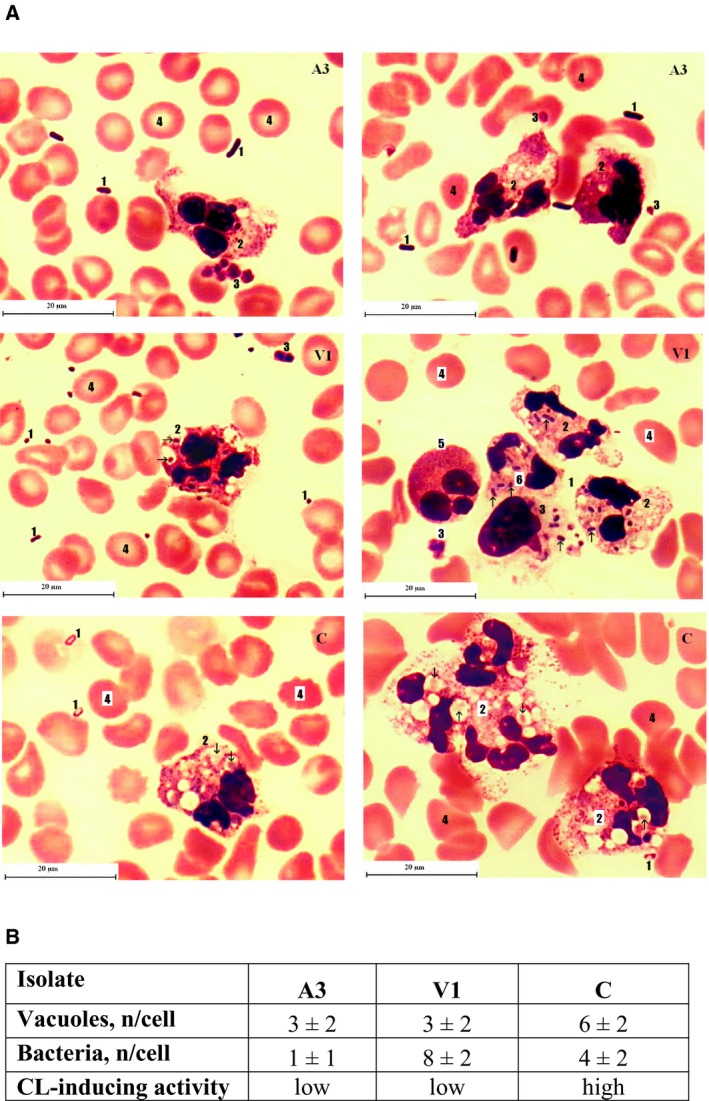
Figure 5.

Effect of E. coli isolates with diverse CL‐stimulating activity on the morphological features of neutrophils. Whole blood samples were incubated with E. coli isolates that have induced low (A3 and V1) and high (C) CL response. The Romanowsky–Giemsa staining was used to visualize the details. At least 50 microscope fields of view per isolate were evaluated for picture and calculations. (A) Typical picture of activated neutrophil for each isolate: 1—E. coli cells; 2—neutrophils/neutrophil aggregates containing vacuoles (arrows indicate the captured bacterial cells); 3—platelets, 4—erythrocytes; 5—eosinophil; and 6—monocyte with captured bacteria. The length of the scale bars is 20 μm. (B) Parameters of phagocytic activity of neutrophils stimulated by E. coli isolates. Mean values are given ± SD.
