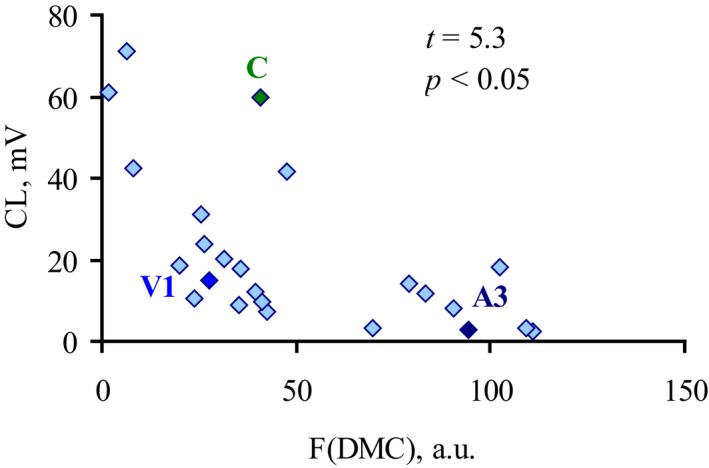
Figure 6.

Correlation between CL response of whole blood neutrophils induced by E. coli isolates and their DMC fluorescence intensity reflecting bacterial surface hydrophobicity. DMC hydrophobic fluorescent probe was added to 24 isolate bacterial suspensions (Table 1), and F(DMC) was recorded at 499 nm. Significance (P) was quantified by the Pearson method for nonlinear correlation (t 0.5 = 2.05).
