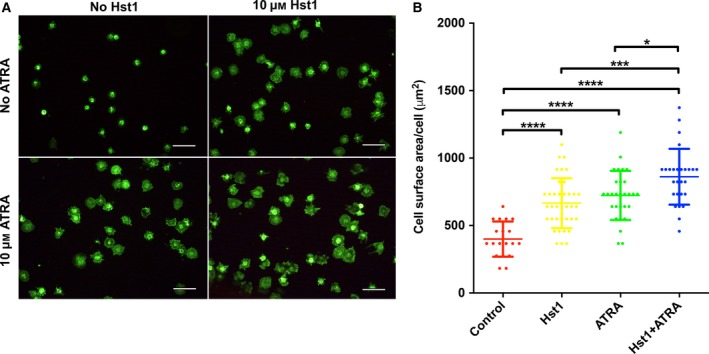
Figure 3.

(A) Fluorescent micrographs depicting the spreading of pre‐osteoblasts (stained with FITC‐Phalloidin) in the presence or absence of 10 µm Hst1 and 10 µm ATRA on bio‐inert glass surface. Bar = 50μm. (B) The surface area per pre‐osteoblast in the presence or absence of 10 µm Hst1 and 10 µm ATRA on bio‐inert glass surface. Data were plotted using graphpad prism (GraphPad Software version 6.0) and analyzed by one‐way ANOVA with Bonferroni's post hoc test for multiple comparisons. Data were shown as mean ± SD (n > 20). *P < 0.05; ***P < 0.001; ****P < 0.0001.
