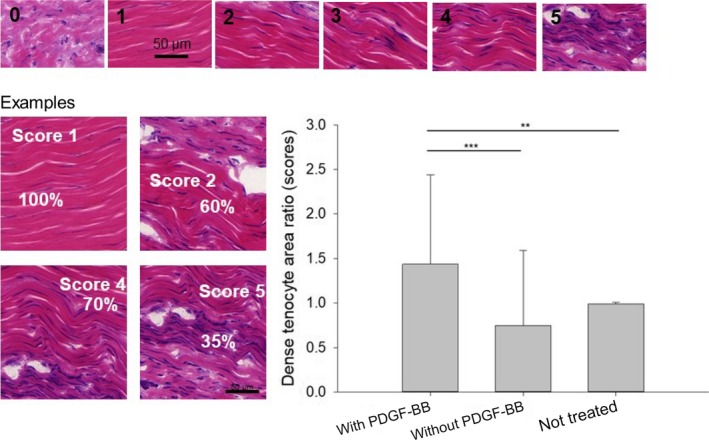
Figure 2.

Dense tenocyte area ratio determined for PDGF‐BB release electrospun meshes 3 weeks postoperation. Semiquantitative scores were defined according to the density of tenocyte‐rich areas in cryogenic sections, stained with H&E. Additional images for scores 1–5 can be found in Fig. S3. Moreover, the percentage of these areas in 15 FOVs per tendon was determined. The ratio was calculated according to: ratio = score × %/100. For determination of the ratio, the zones with mainly mature tenocytes (with a slender spindle‐shaped morphology) have been considered. One‐way ANOVA was performed. P values < 0.05 were considered significant (*). If P < 0.01, this was marked by **, and if P < 0.001 by ***. Error bars indicate standard deviations. Biological independent replicates n = 6. Scale bars = 50 µm.
