
Figure 4.
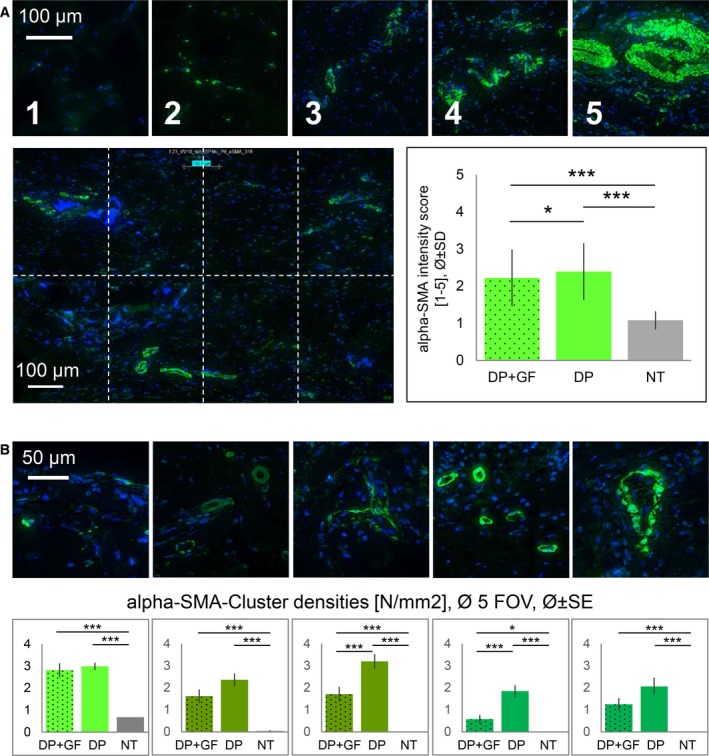
Alpha‐SMA+ cells. Semiquantitative scoring system: 1–5 definition (A top row), analysed in five FOVs, each FOV with eight rectangles (A bottom left); Cluster densities: visualization of cluster categories (B top row) and mean densities (B bottom row) of the corresponding cluster type. Cluster categories (from left to right): small full clusters with circumference < 100 µm; precursor vessels < 100 µm; precursor vessels > 100 µm; well‐developed vessels < 100 µm; well‐developed vessels > 100 µm. DP = DegraPol®, GF = PDGF‐BB, NT = not treated. One‐way ANOVA was performed. P values < 0.05 were considered significant (*). If P < 0.01, this was marked by **, and if P < 0.001 by ***. Error bars indicate standard deviations. Biological independent replicates n = 6. Scale bars in A = 100 µm; in B = 50 µm. Additional images for scores 1–5 can be found in Fig. S5A, and for different cluster size in Fig. S5B.