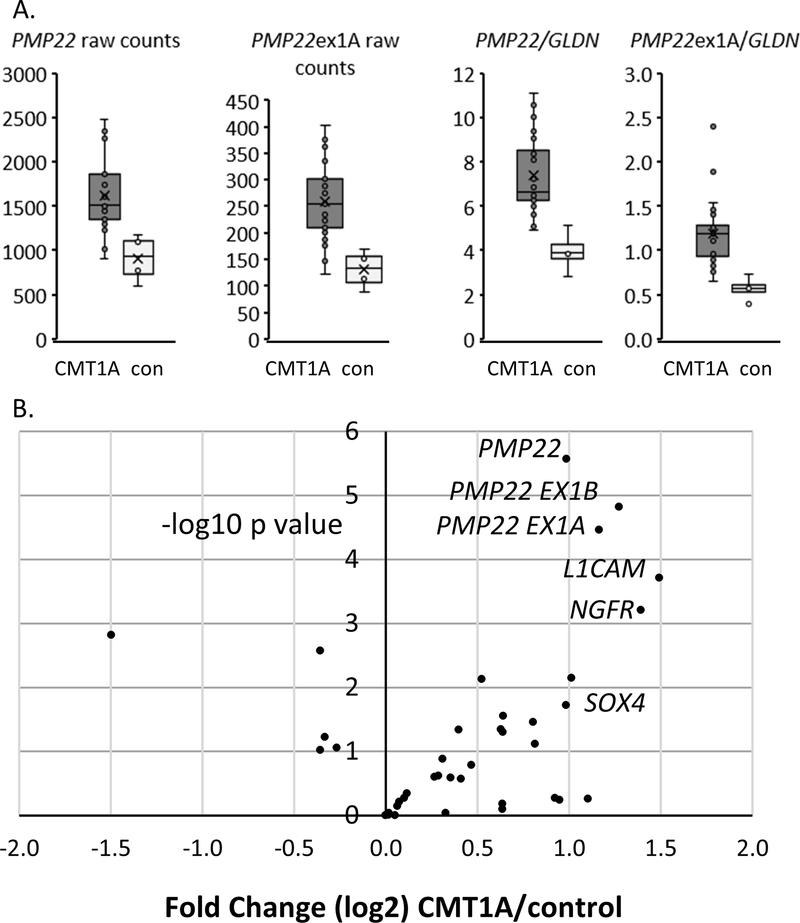
Figure 2. Nanostring analysis of CMT1A skin biopsies.
A) Equal amounts of skin biopsy RNA’s were applied to the custom Nanostring panel, and the plots show raw counts of total PMP22 as well as the Schwann cell-specific Exon 1A form of PMP22. In addition, the ratio of both forms to the Schwann cell-specific GLDN is shown. (21 CMT1A and 4 control, avg. age 48.2 and 51.2 yr, respectively)
B) The volcano plot shows each of the genes (dots) ranked with the most statistically significant changes between control and CMT1A skin biopsies in the upper right quadrant. The results are normalized to the geometric mean of six SC-specific normalizing genes including GLDN using Nanostring nSolver software, and the plot shows levels (log 2, x-axis) plotted against the significance of the changes (negative log10 p value) between control and CMT1A. The plot shows elevation of total PMP22 in CMT1A samples along with specific probes for its two major transcripts (Ex 1A and Ex 1B), and also increased levels of NGFR and L1CAM. (21 CMT1A, 4 controls).

