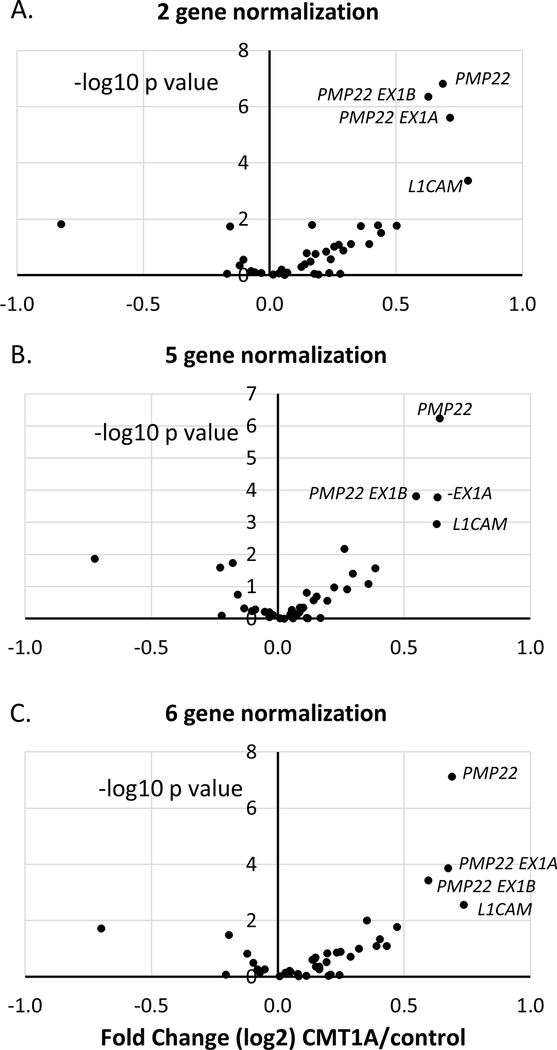
Figure 3. Nanostring analysis with alternate normalization methods.
Nanostring results from skin biopsies are shown for 11 controls and 32 cases, from three separate runs. The volcano plot shows levels (log 2, x-axis) plotted against the significance of the changes (negative log10 p value) between control and CMT1A. The results are normalized to the geometric mean of two Schwann cell specific genes (A), 5 SC-specific genes (B) or six SC-specific normalizing genes (C).

