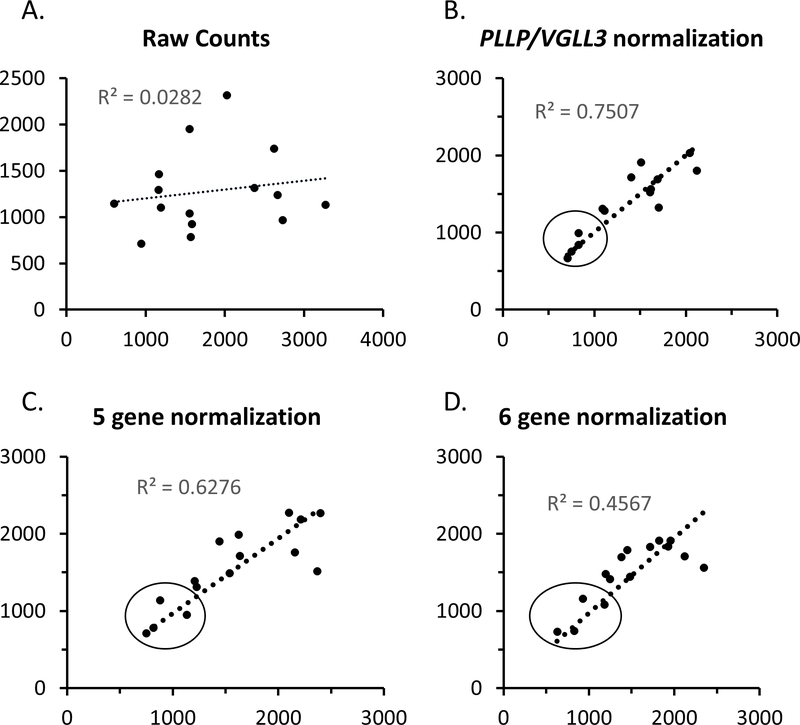
Figure 4. Nanostring Analysis of PMP22 levels in duplicate skin biopsies.
For selected control and CMT1A cases, the two skin punches were processed independently and submitted for Nanostring analysis in order to test the intra-subject variability of the results. The correlation plots show the PMP22 values for the two samples from each subject using A) raw counts or B-D) using several alternate normalization methods employing different combinations of Schwann cell-specific genes. The line shows the best fit of the data, and the r2 value is indicated. The circled points show those that were obtained from control subjects, which have consistently lower levels of PMP22 than the remaining CMT1A cases.

