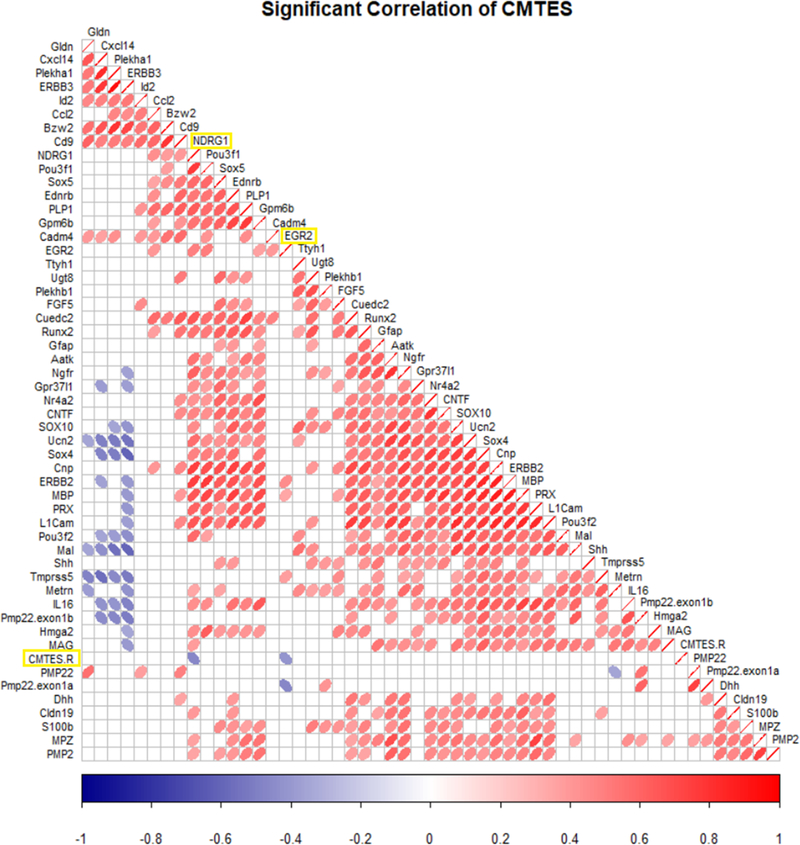
Figure 5. Correlation analysis of CMTES-R with gene expression levels.
Nanostring gene expression levels normalized to PLLP/VGLL3 were correlated with CMTES-R to determine significant correlations. Correlation values using Pearson’s method are represented in the correlogram. The strength of the correlation is indicated by the heat map scale for ellipses, showing positive (red, right leaning), and negative correlations (blue, left leaning). The row labeled as CMTES-R shows two inverse correlations with EGR2 and NDRG1, which are significant at a 95% confidence interval. There was no significant correlation of CMTES-R with PMP22 levels.

