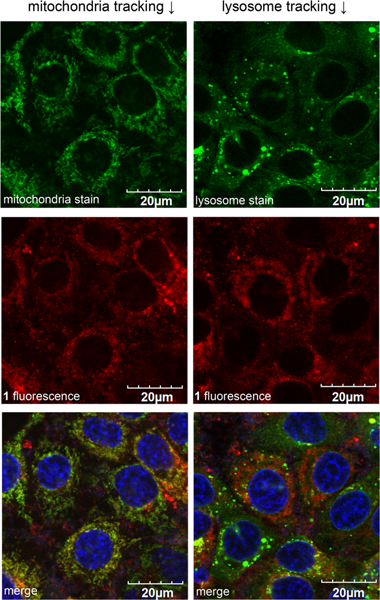
Figure 3.

Confocal imaging of HepG2 cells treated with 1 and MitoTracker Green, Pearson’s coefficient 0.72 (left column) or 1 and LysoTracker Green, Pearson’s coefficient 0.56 (right). Nuclei stained with NucBlue are included in the merged images in the bottom row. The images were taken at 60×/1.20 water immersed objective.
