
Fig. 3. Effect sizes for CSF sTREM2 and CSF p-tau181.
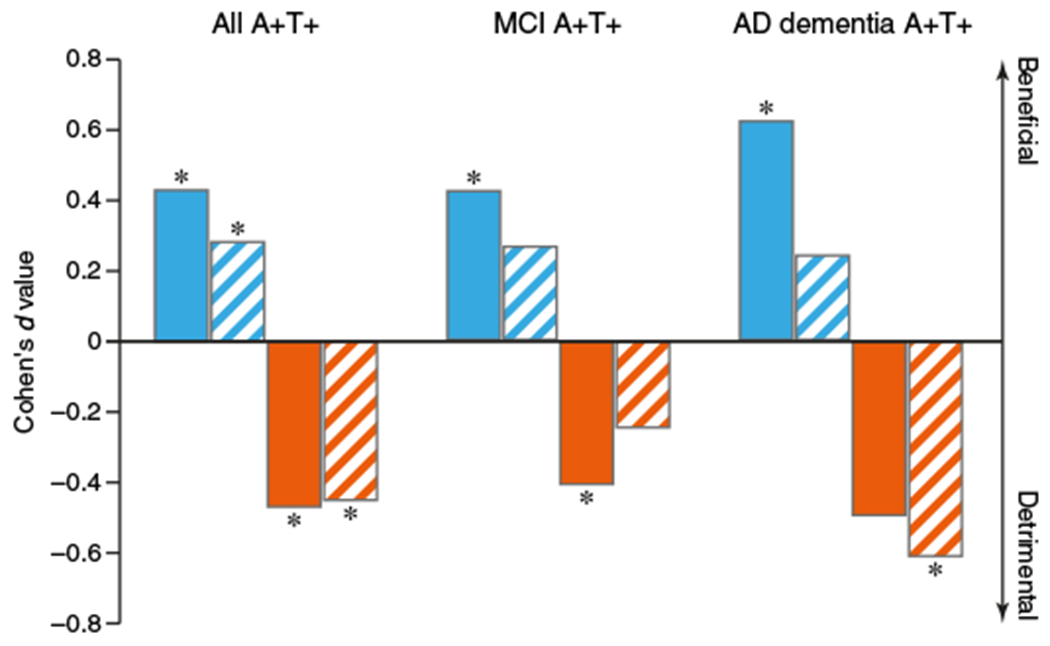
Bars show the effect size (Cohen’s d value) of the association between CSF sTREM2 concentrations (blue) or CSF p-tau181 concentrations (orange) on the rate of change in episodic memory (assessed by the ADNI-MEM score; solid bars) or global cognition (assessed by the ADAS13 score; striped bars). The effect sizes derived from linear mixed-effects analyses are shown for all subjects who were positive for CSF Aβ1–42 and CSF p-tau181 (A+T+) at different clinical stages (MCI, n = 184; AD dementia, n = 66) and after the data were pooled (n = 285). A positive d value means that higher CSF concentrations were associated with slower cognitive decline (less decrease in the ADNI MEM score and less increase in the ADAS13 score). A negative d value means that higher CSF concentrations were associated with worse cognitive decline as determined by mixed-effects regression analyses. *P < 0.05.